![Which Cities are Getting Back to Work Fastest? [Data Study]](/_next/image/?url=https%3A%2F%2Fmedia.getvoip.com%2Fuploads%2Fcities-back-to-work-min.png&w=3840&q=75)
The pandemic brought entire industries and bustling metros to a complete standstill. Followed by 12 grueling months of rolling lockdowns and varying phases, needless to say, the US is ready to get back to work.
Some American cities are getting back to work faster than others. To help define which cities are ahead of the pack, GetVoIP analyzed economic and health data of the largest metropolitan areas in the US.
Factors evaluated by GetVoIP included a city's change in unemployment over the last year, foot traffic, business restrictions, COVID vaccine rates and the percentage of people testing positive this month, to account somewhat for the rise of the new variant.
Cities with the greatest recovery in unemployment rates ranked highly, especially those with a fully vaccinated population, as they have the highest potential for dodging future outbreaks.
Exactly how fast the economy recovers will vary city-by-city, but the data provide a good picture as to which major metropolitan areas are well on their way. Everyone loves a good comeback story and these 10 U.S. cities are getting back to work the fastest.
View our methodology here.
1. Providence, Rhode Island
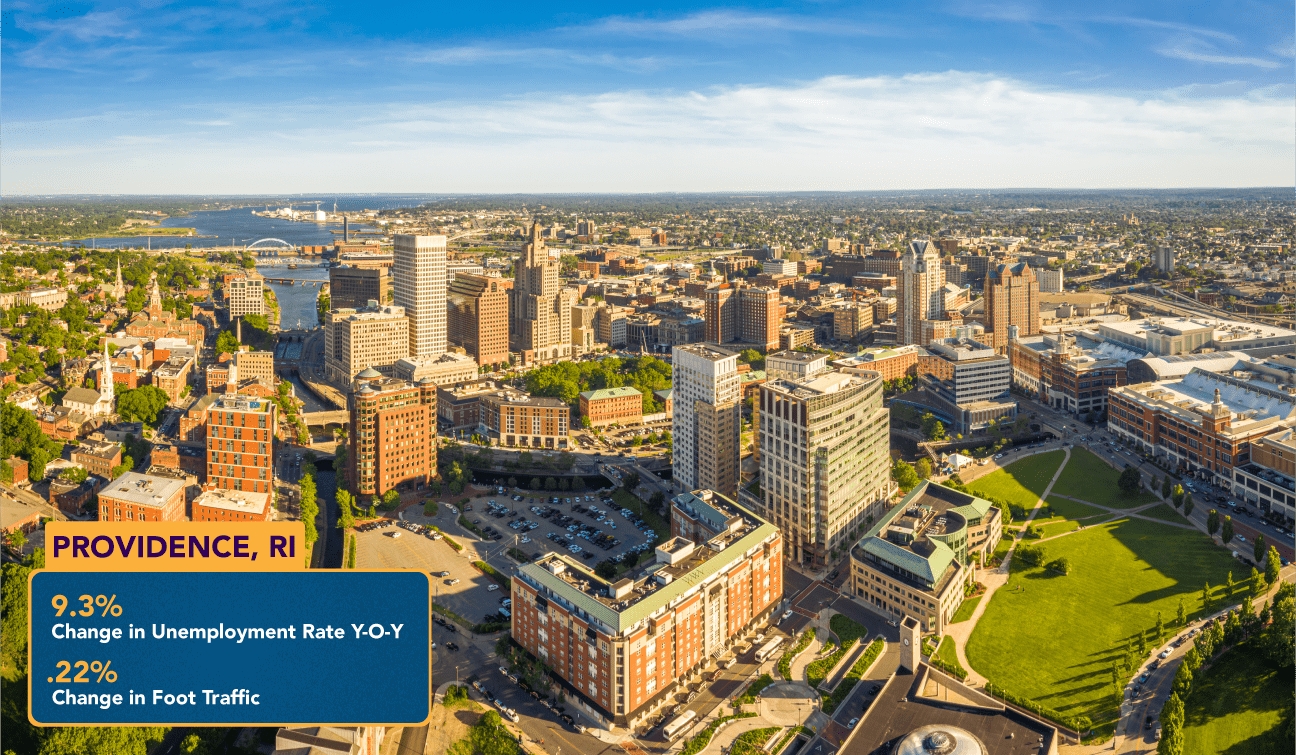
Providence is the number one city in the US getting back to work the fastest. It wins first on our list because of its consistently high marks across the board.
With a 9% change in the unemployment rate year over year (May 2020 vs. May 2021), a moderate timeline of restrictions and a good amount of the population vaccinated, Providence is starting to see its workforce return to normality.
Since the population also is only experiencing a positive COVID testing rate of 1.4% (as of July 24, 2021), it appears that Providence is maintaining its economy while keeping infection rates low. This bodes well for their continued success in the midst of the Delta variant.
2. Chicago, Illinois
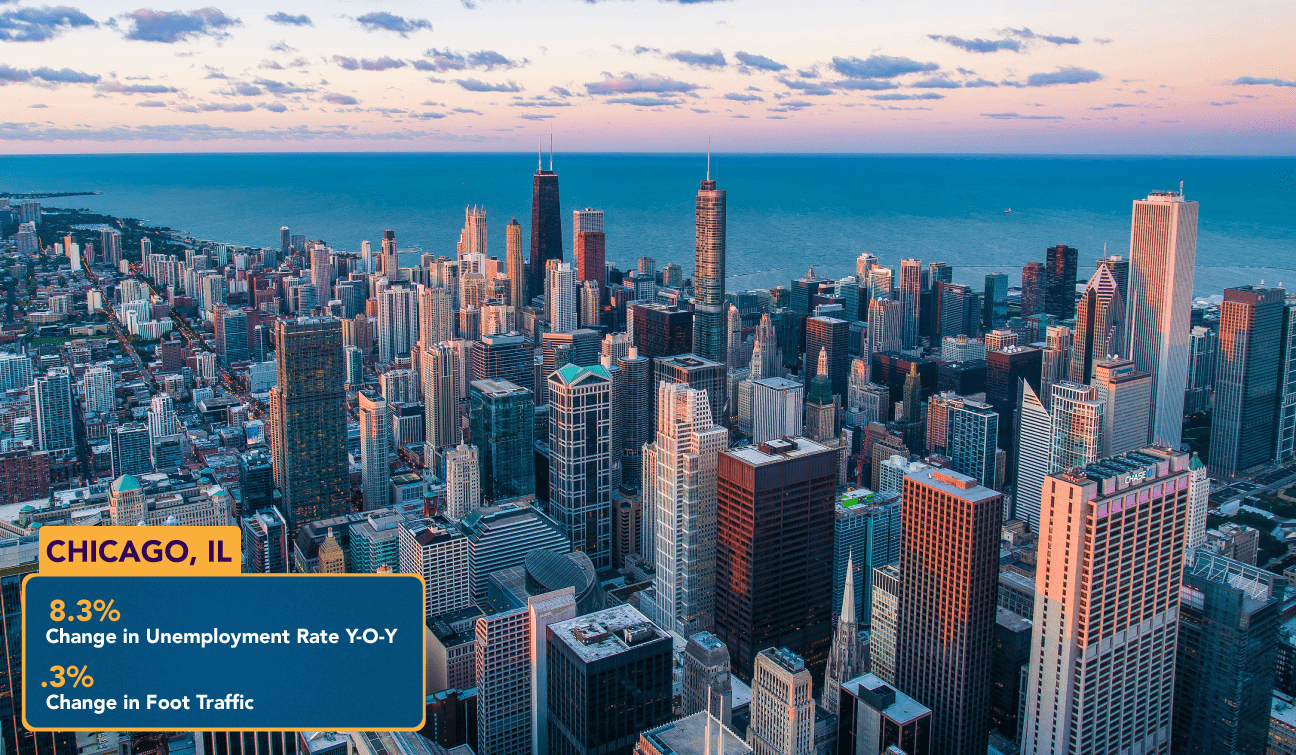
Chicago ranks among the top 20 on our list for change in the unemployment rate, coming in at 8.3% year over year. At the height of the pandemic, Chicago had an unemployment rate of 15.6 (May 2020) and as of May 2021, that has reduced to 7.3.
This is a huge accomplishment! And, it is reflected in increased foot traffic, 0.30. A high vaccination rate (52%) and a relatively low test positive rate (2.2%) mean Chicago is likely to continue seeing strides in the right direction in the coming months.
3. Boston, Massachusetts
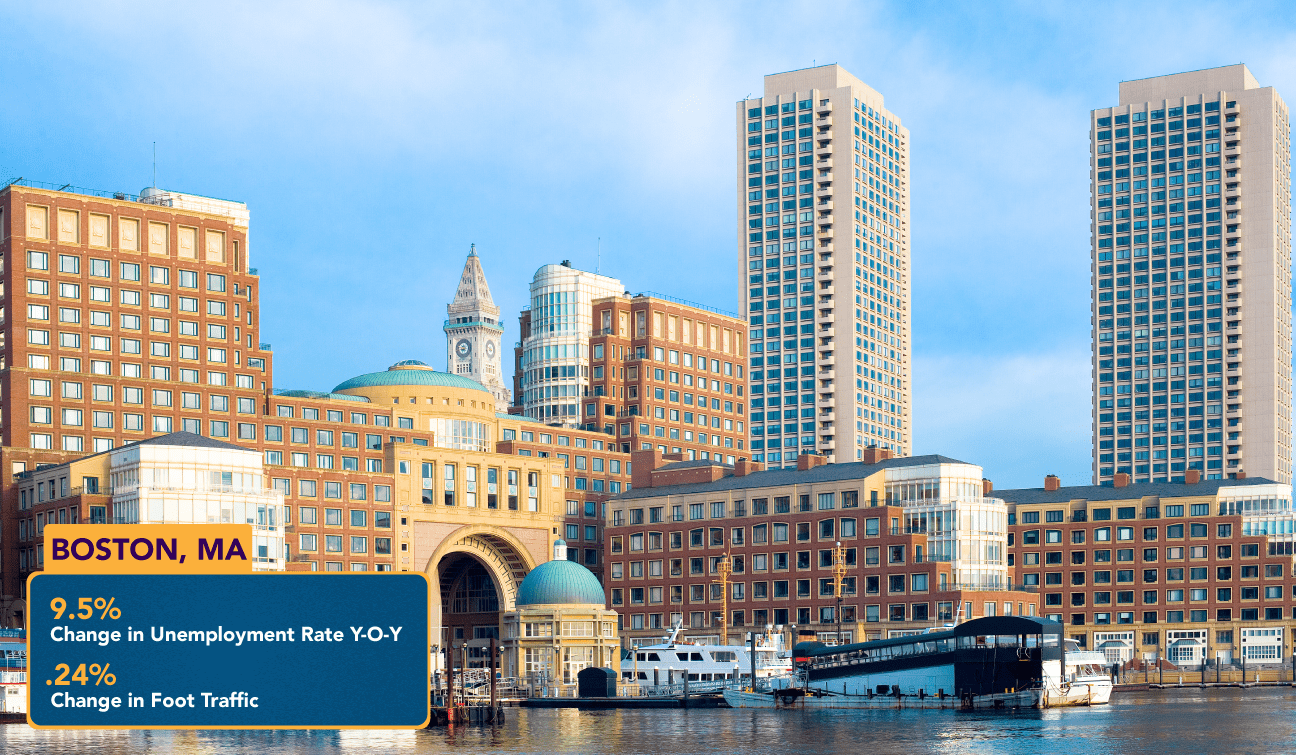
With a 9.5% change in unemployment from May 2020 to May 2021, a moderate change in foot traffic to businesses, and a shorter time under business restrictions, Boston is booming back to life.
The city’s impressive fully vaccinated rate of 62% (one of the highest on our list) hints at the fact that they will be able to withstand another wave of COVID, and their 1.2% positive test rate shows they are taking the precautions necessary to do so.
4. Cleveland, Ohio
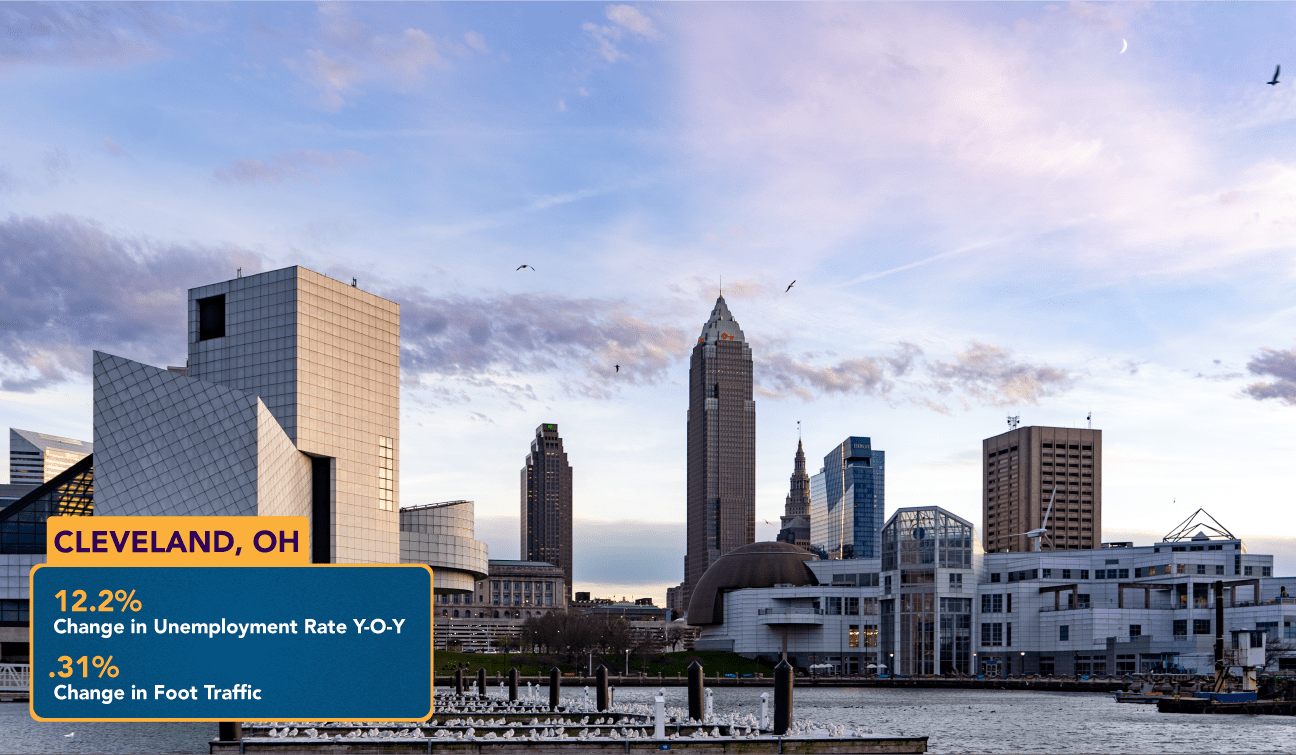
Ranking in the top five cities for change in unemployment rates (12.2% YOY), a high shift in foot traffic coupled with a 50% fully vaccinated populace is what propelled Cleveland to the top half of our list.
With a low 1.7% test positive rate, Cleveland is doing its best to maintain this momentum into 2021.
5. Buffalo, New York
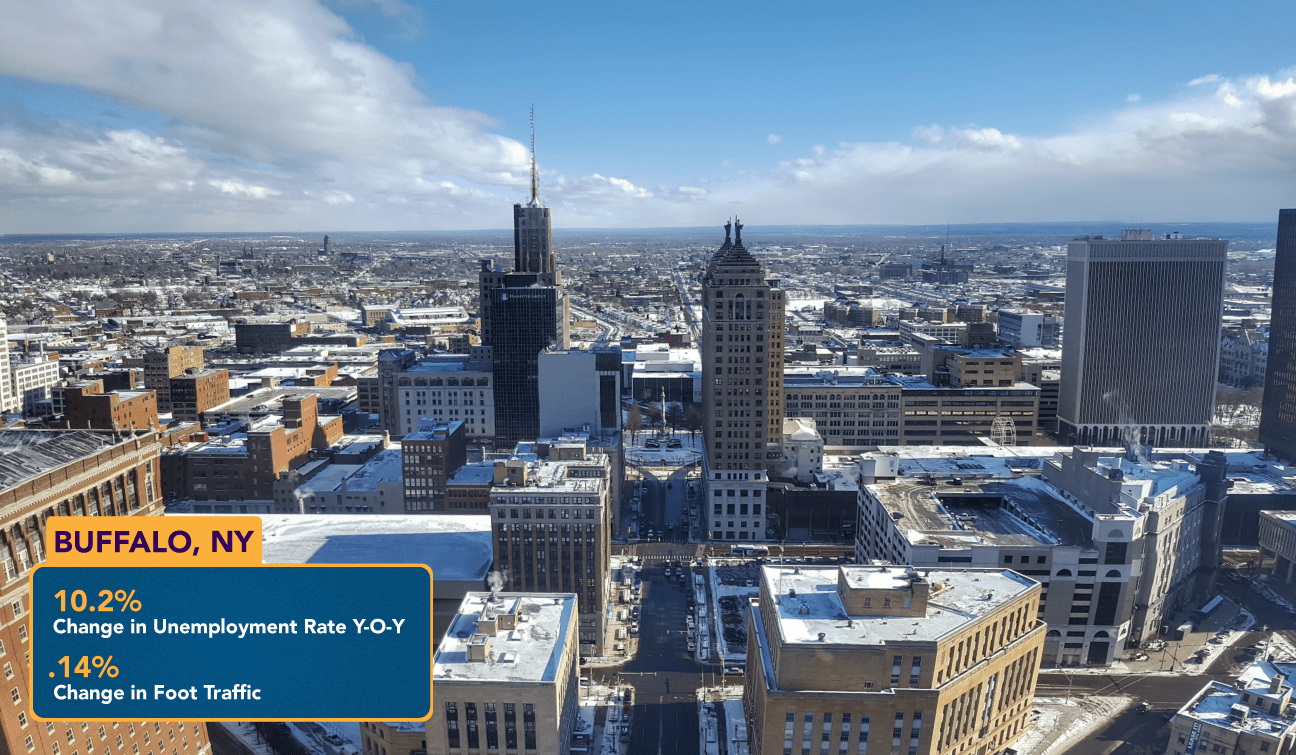
Buffalo, NY takes the number five spot, largely in part to its really solid changes in unemployment and the fact that over 50% of the population are fully vaccinated. This tells us that not only are people getting back to work, but they are taking the necessary precautions to ensure they fare well against the newly rising delta variant.
COVID restrictions were in place longer here, and foot traffic is slowly picking back up, which indicates a strong return to work, albeit slower.
6. New York, New York
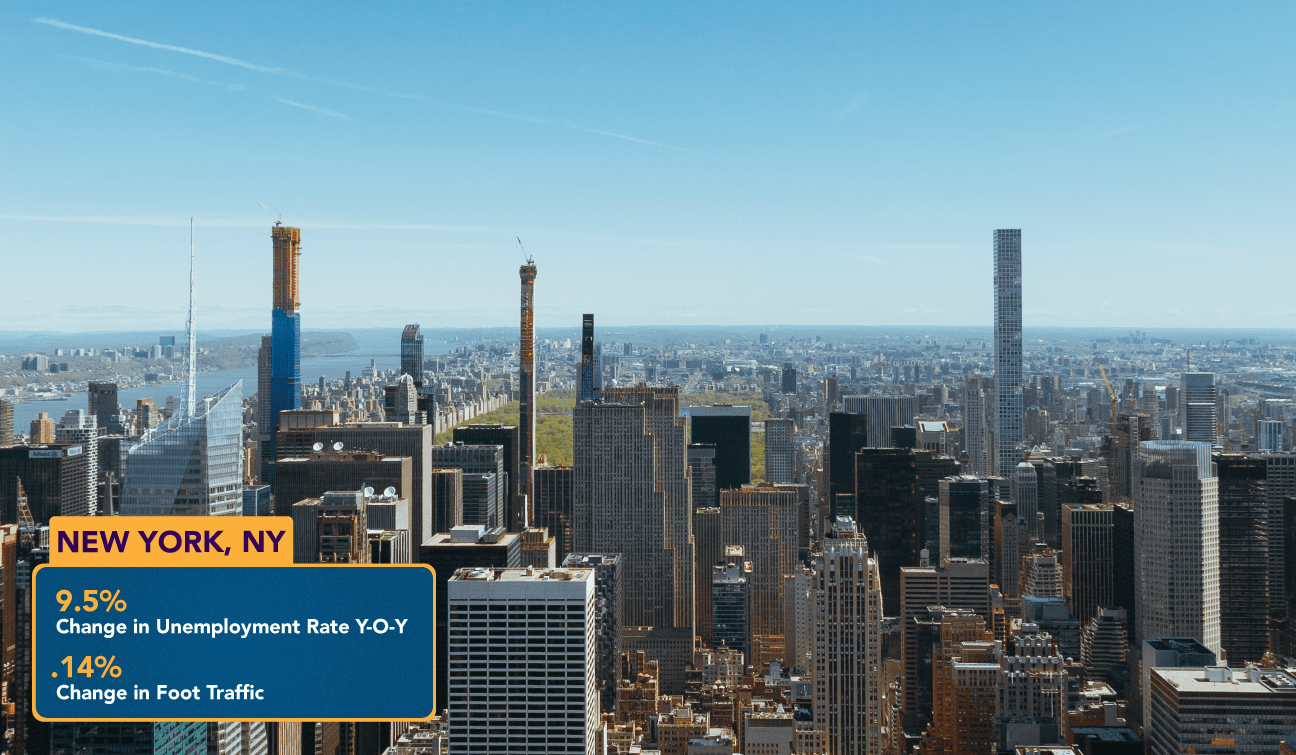
With a 9% change in the unemployment rate in May 2020 vs May 2021, New York appears to be getting back to business, albeit more moderately than some of the other top picks on our list. With a 55% vaccination rate and 2% positive test rate, New York City appears to be doing its best to keep up with business as usual.
7. Minneapolis, Minnesota
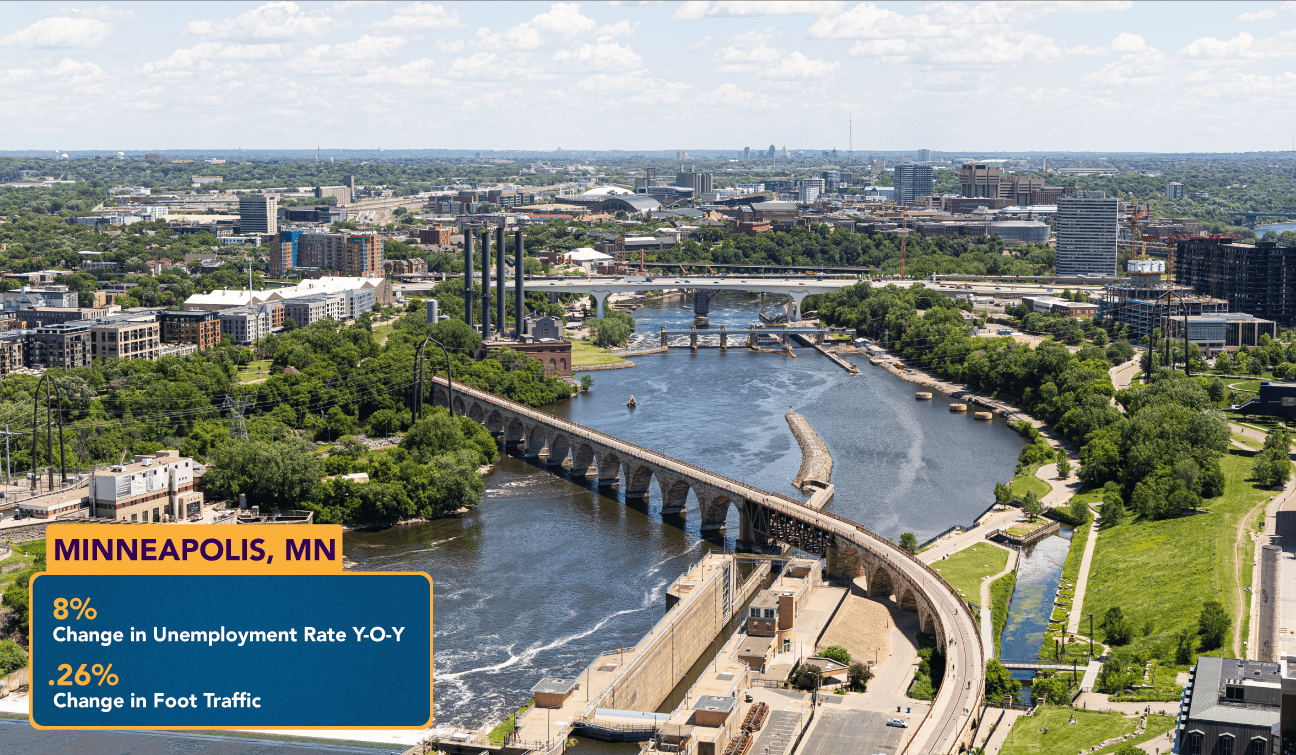
Ranking about halfway down our list for change in the unemployment rate, Minneapolis is also doing its best to get back to work.
With lighter business restrictions than some states and a fairly high percentage change in foot traffic, Minneapolis is well on its way to recovery. Since 53% of the population is vaccinated, the city is all set up for success.
8. Raleigh, North Carolina
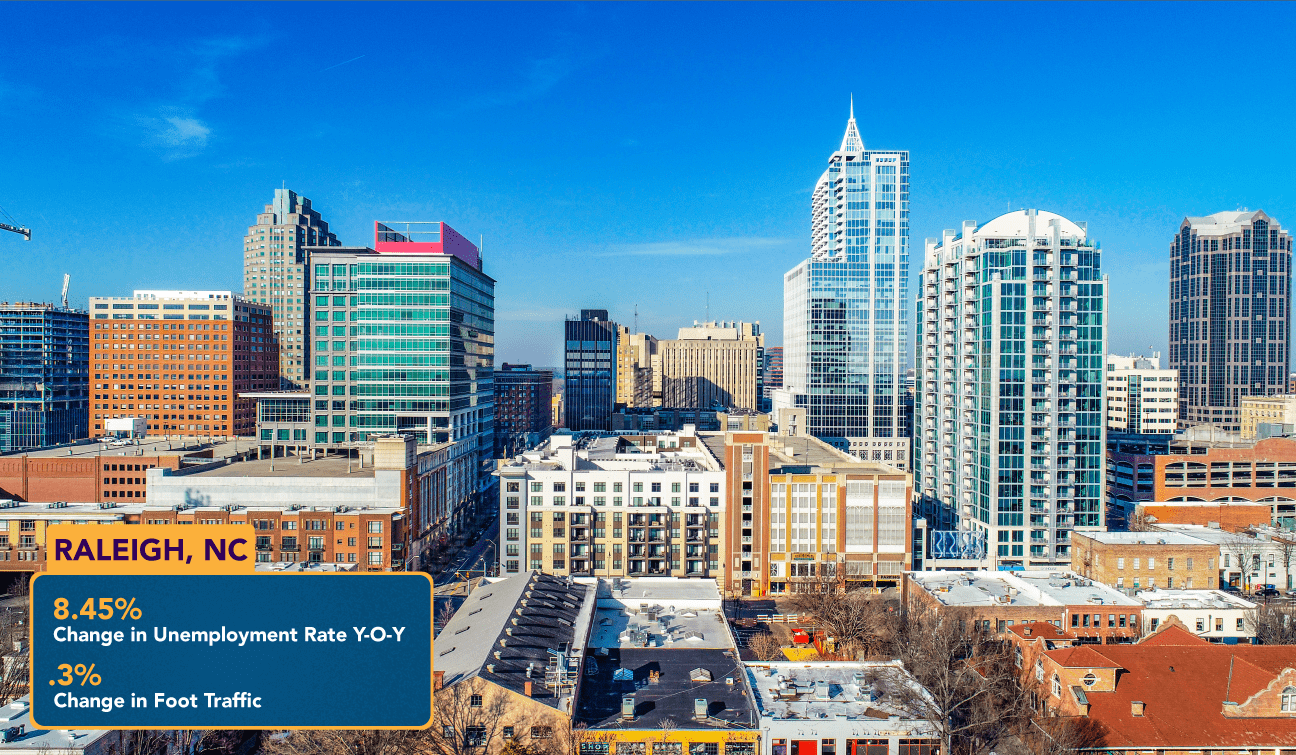
North Carolina never issued stay-at-home orders, but Raleigh saw a significant jump in both foot traffic and the unemployment rate (8.5%). With just over 50% of the population vaccinated at the time we conducted this study, and a moderate positive COVID test rate, business in Raleigh has been chugging along.
9. Detroit, Michigan
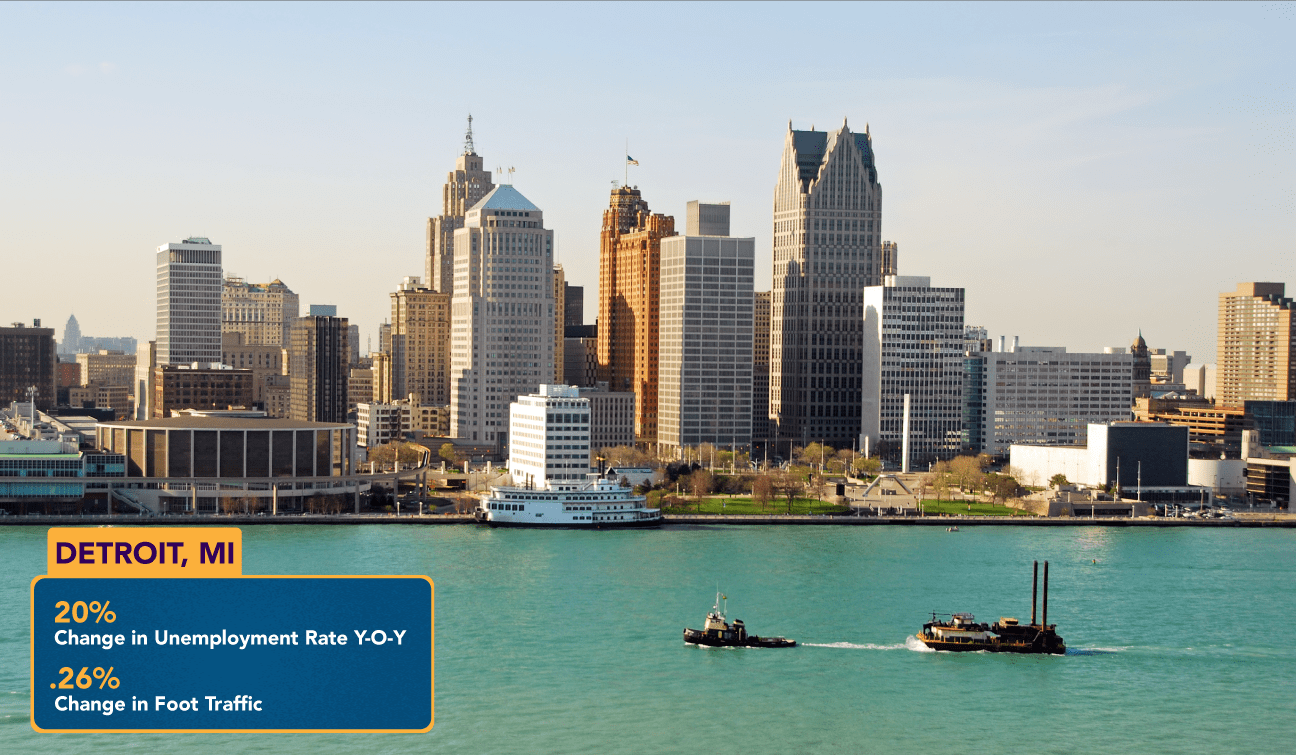
When you think of the most obvious factor to determine which cities are getting back to work the fastest, you think of year-over-year changes in unemployment rates. Which city has improved its unemployment rate the most? Detroit.
Detroit has the greatest change in unemployment rates from May 2020 to May 2021 among all of the major US metropolitan areas. So, why did Detroit end up so far down on GetVoIP's list?
Despite a high change in unemployment rates, COVID restrictions on businesses lifted last in our data sample, and vaccine rates remain low. Only 45.9% of the populace is fully vaccinated. This may be why foot traffic remains less than ideal for a city on the full upswing.
10. Milwaukee, Wisconsin
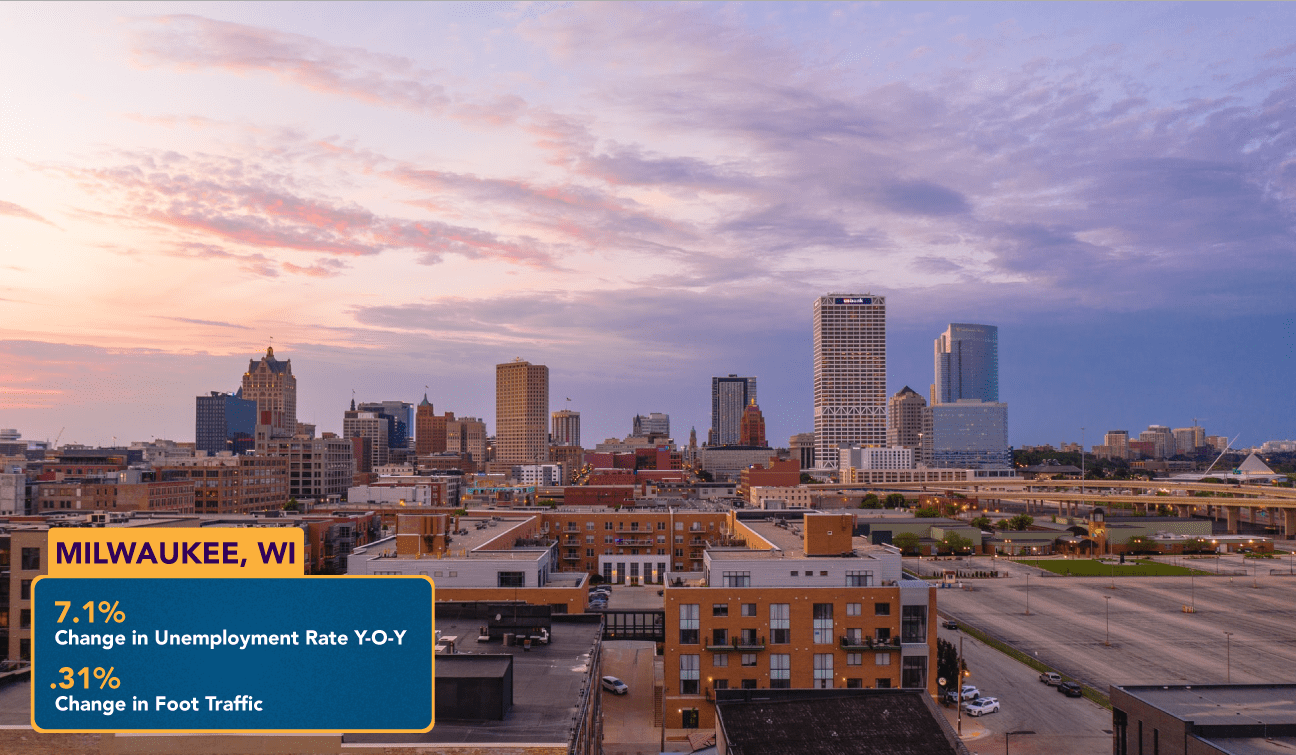
Sitting around the middle when it comes to change in the unemployment rate, Milwaukee spent fewer days under business restrictions than many of the cities our data examined. With moderate changes in both foot traffic and vaccination rates, Milwaukee just barely scooted onto our list.
Other Findings Of Our Research
Cities located in states that never issued a stay-at-home order didn’t make up a large portion of our list, which could be because the unemployment rate didn’t change as much. It could also be because many of these states are lower in population, meaning many of their cities didn’t make our original data set.
- The states of Nebraska, Arkansas, Iowa, North Dakota, Oklahoma, South Dakota, Utah, and Wyoming never issued stay-at-home orders.
- Detroit, Michigan, saw the largest change in the unemployment rate at 20.2%, followed by Las Vegas, Nevada (19.2%) and Orlando, Florida (17.2%).
- The state of Arkansas saw the biggest change in foot traffic as of June 6, 2021.
- Major metros with the highest vaccination rate as of July 24, 2021, are
- San Jose, CA
- San Francisco, CA
- Portland, OR
- Boston, MA
- Hartford, CT
The pandemic and its effects had been anything but predictable. However, now that we can scan through the data collected over this period, we can see that many US cities are ready to return to pre-pandemic normalcy. While the cities in this GetVoip list take the lead in getting back to work, the other cities can heed their example and follow suit.
Methodology
To find out which cities were getting back to work fastest, GetVoip collected May 2020 and May 2021 change in unemployment rates for the largest metropolitan areas, as sourced from the U.S. Bureau of Labor Statistics, last updated: June 30, 2021. The largest metropolitan areas were defined as having a 2010 census population of 1 million or more.
We considered what factors may encourage a faster return to work and what factors indicate an awakening economy for these 50 metropolitan areas. One indicator would be lifted covid restrictions. Foot traffic data would be used as a signal that the economy was awakening and people were actually out and about, and COVID vaccination rates may provide cities a catch-net to stop them from sliding backward with future outbreaks.
GetVoip gathered additional data about the length of time the states had business restrictions in place (USA Today), foot traffic patterns by state (SafeGraph) and COVID vaccination rates by metro (COVID ActNow). In light of the new Delta variant, we added the positive COVID test rate as a negative factor.
Finally, all factors were scored individually and combined. Change in unemployment held double weight. Rankings were determined in order of the highest total score.
Raw Data and Calculations Here