Total employee separations in the US have increased steadily year over year since 2017. Starting at 59.9% in July 2017 and increasing by approximately 4% every year until 2020, the US employee turnover rate ballooned to 80%. (ADP)
This accelerated greatly in 2020, in part due to COVID and in part due to a talent shortage with increased competition for top talent. However, that changed as the pandemic came to an end.
According to the ADP workforce report, the national turnover rate decreased from 82.2% in Q1 2021 to 71% in Q2 2021.
The above numbers are an aggregate turnover rate, meaning they represent an average across all industries, positions and reasons for departure in the United States.
Averages help us get a high-level view of the nation’s workforce vitality, but they cannot be used as a benchmark for assessing your individual company’s employee churn. If your interest is in learning how to keep (and attract) high-quality talent, it is best to focus on the churn rate specifically for voluntary separations — or to put it simply — “quits.”
How Do You Calculate Employee Churn Rate?
The first step to calculating employee churn is to gather the following numbers from your HR department:
- (A) the number of employees at the start of a given time period (e.g. a year)
- (B) the number of people who voluntarily quit during that time period
Then calculate your (voluntary) employee churn rate by using this formula.
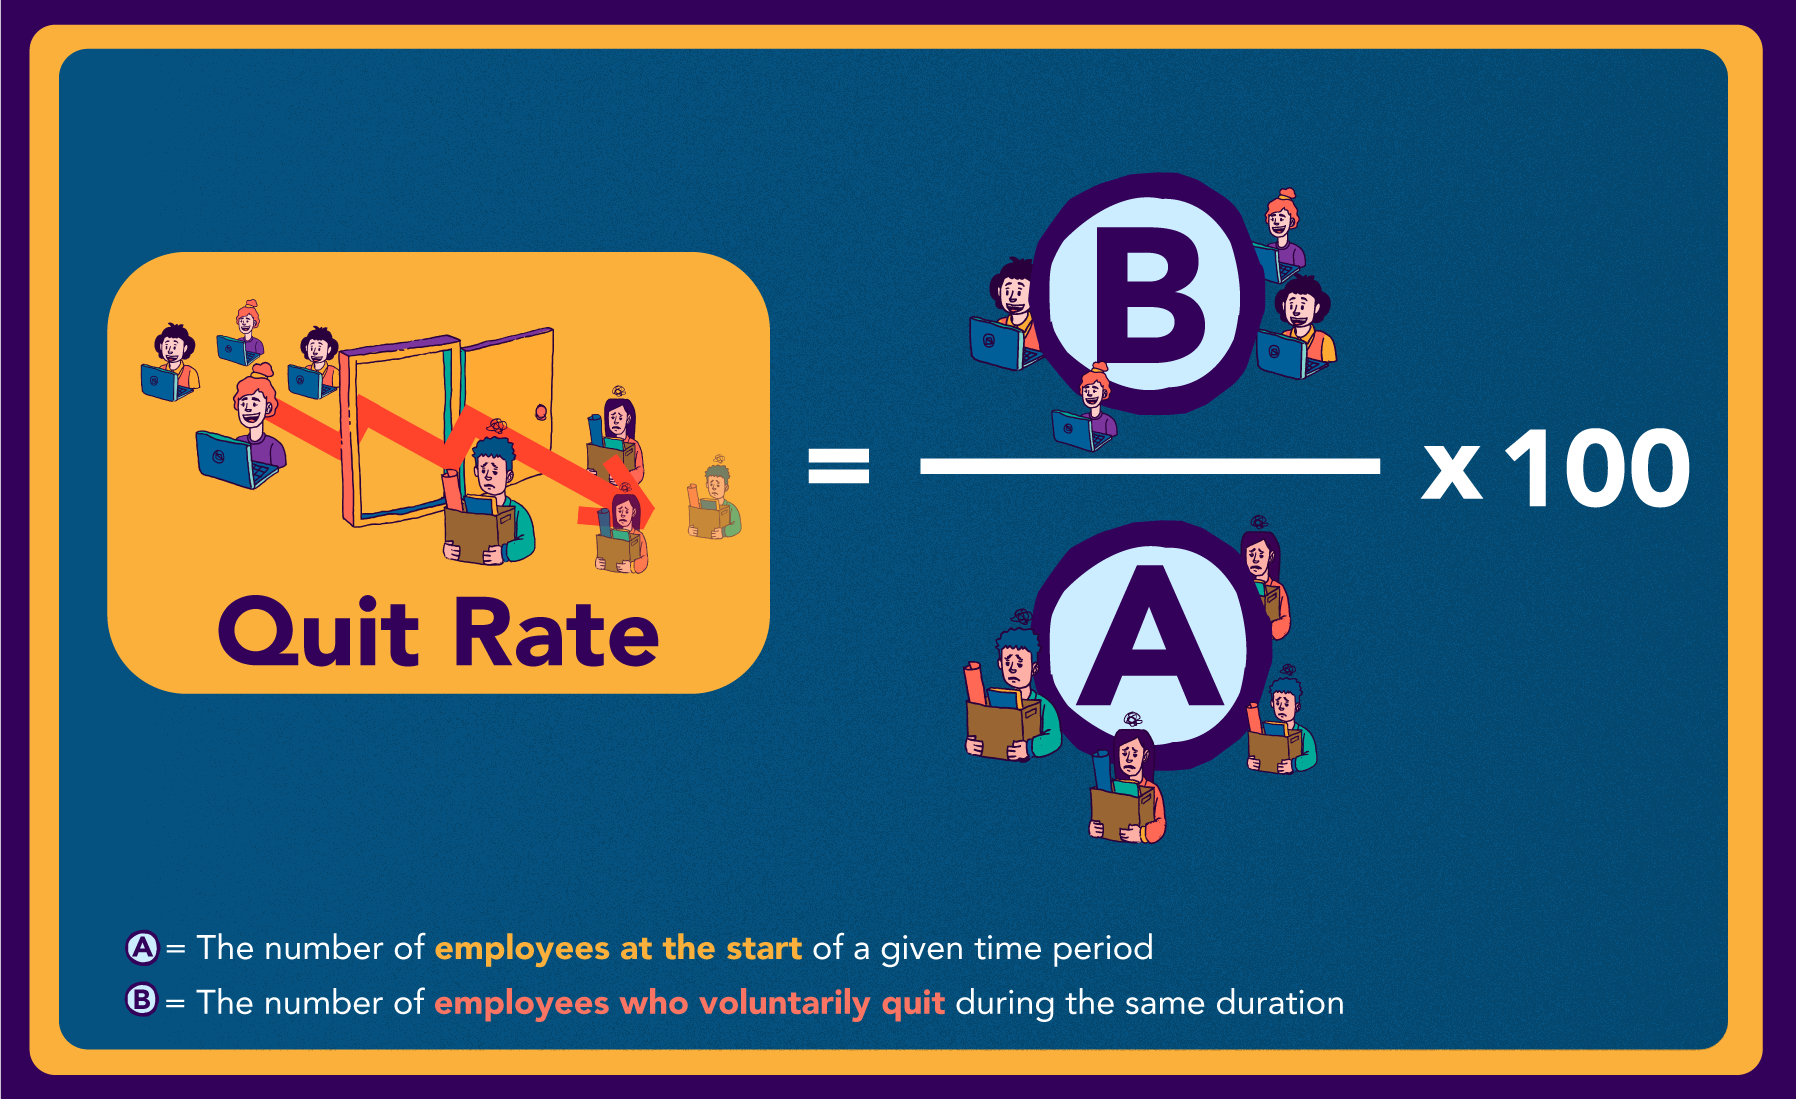
For example, you are managing a restaurant and at the start of Quarter one in 2021, you employed 15 people (A). During Quarter one, two employees resign (B). Using our employee churn rate formula, your quit rate for Q1, 2021 was 13%. If this trend continues, the total annual quit rate will be 53.33%.
Now that you have calculated your unique quit rate, the next step is to compare this number against the average for your industry.
GetVoip put in the leg work by finding the most comprehensive data available on voluntary employee churn. By comparing and contrasting data from the U.S. Bureau of Labor Statistics (BLS) historical vs. 2020 pandemic-era quit rates by industry.
The following is a list of the top 10 industries with the most employee churn in the US.
1. Accommodation and Food Services
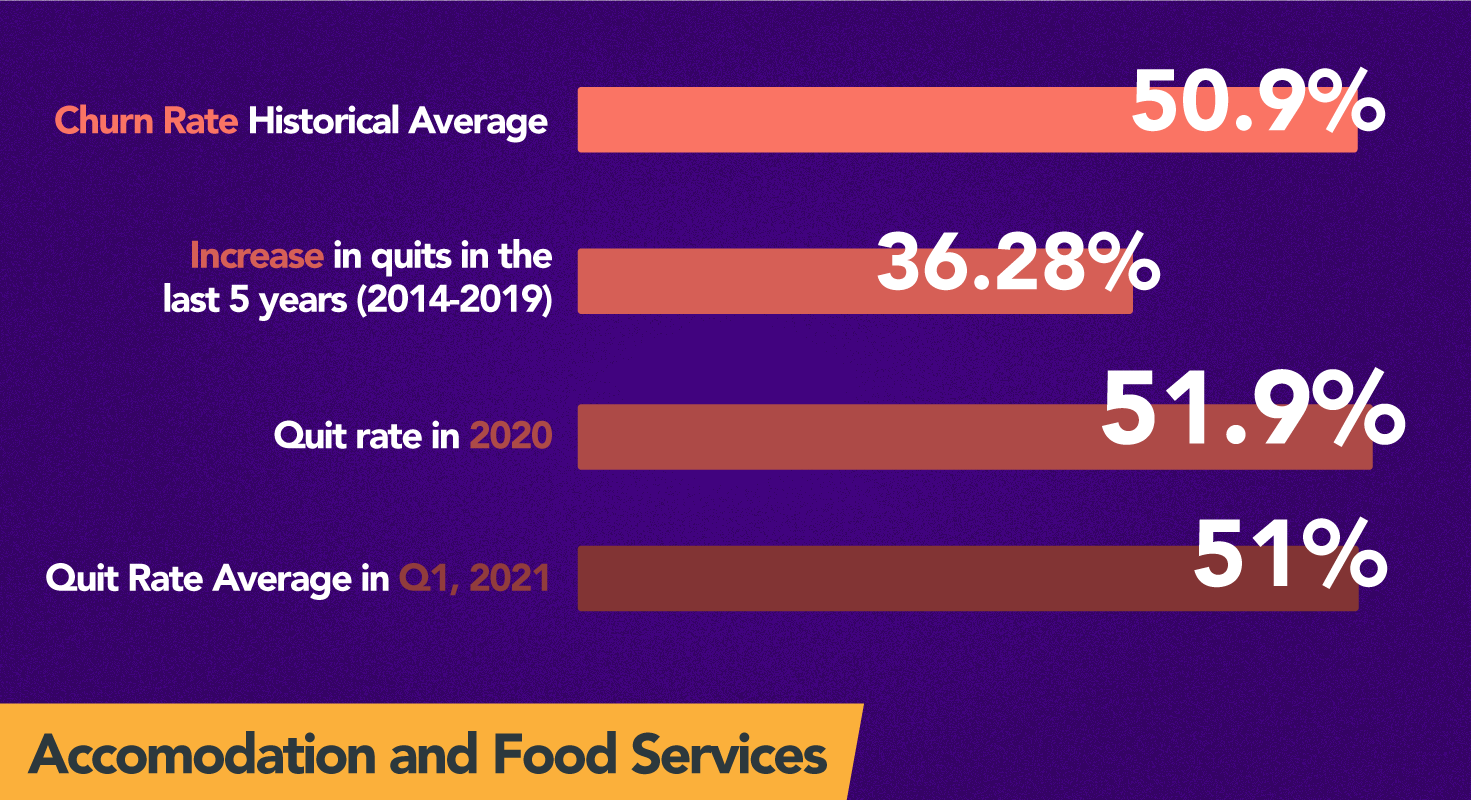
Accommodation and Food Services is a sector within the supersector of Leisure and Hospitality. It is made up of establishments providing customers with lodging and/or preparing meals, snacks and beverages for immediate consumption. IE: fast food preparation and serving workers, cooks, desk clerks, waiters and waitresses.
Historically, Accommodation and Food Services has been the top industry with the most employee churn in the US, probably due to contract work and temporary staff. The quit rate increased by 36.28% in the last 5 years (2014 - 2019), reaching an all-time high of 58.6% in 2019.
2. Retail Trade
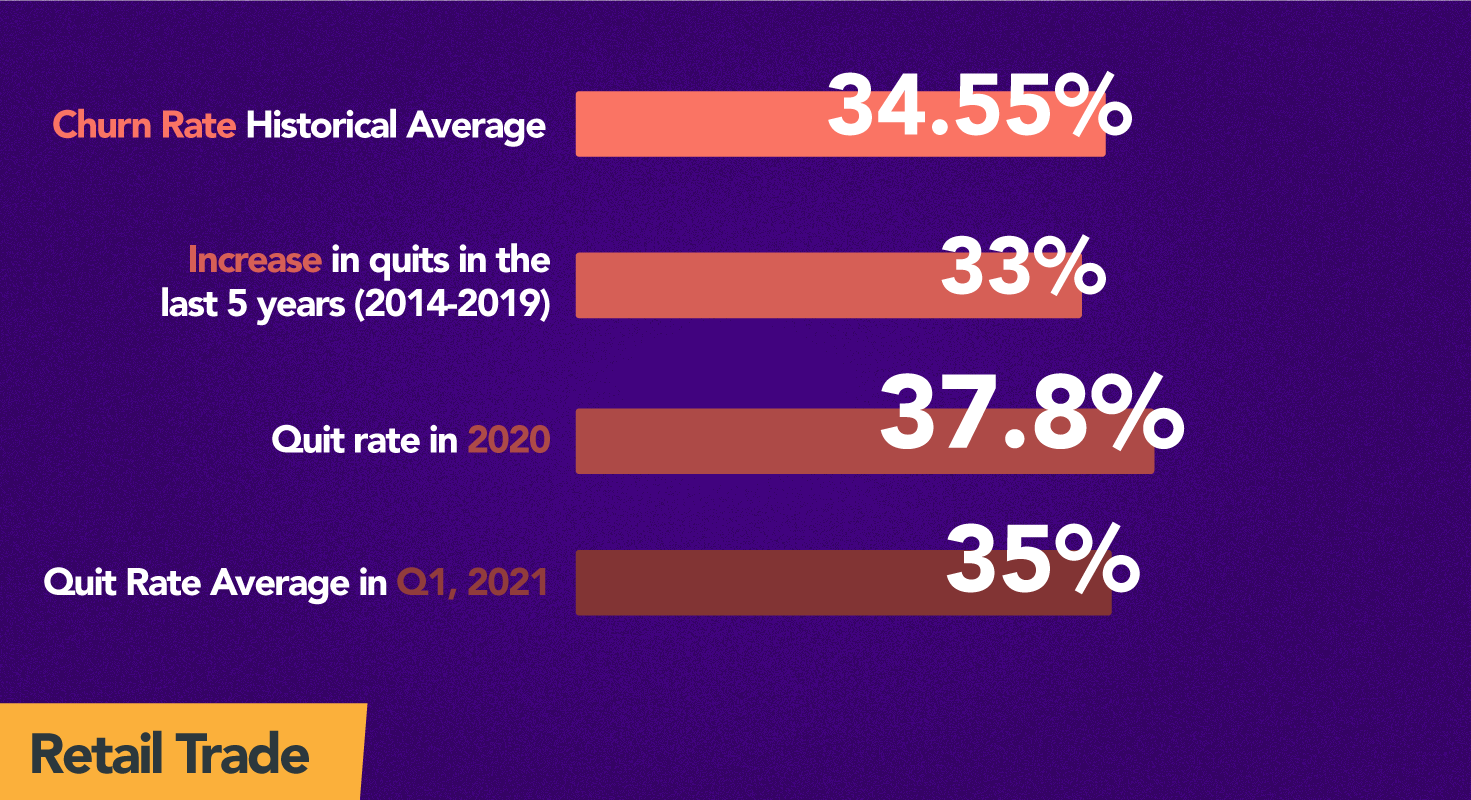
Retail Trade is split into two main types of retailers: store and non-store. Stores are fixed point-of-sale locations, or what is commonly known as “brick and mortar.” Nonstore retailers reach customers through alternative methods. Think of infomercials, catalogs, in-home demonstrations and (nonfood) street vendors.
Second to the supersector of Leisure and Hospitality, Retail Trade is the industry with the highest voluntary turnover rate in the US. Its quit rate increased by 33% in the last 5 years, reaching an all-time high of 39.9% in 2019.
Interestingly, this spike in quits was in tandem with unemployment being at a historic low for the US. It might signal the workers felt confident in their ability to make a career move.
3. Arts, Entertainment and Recreation
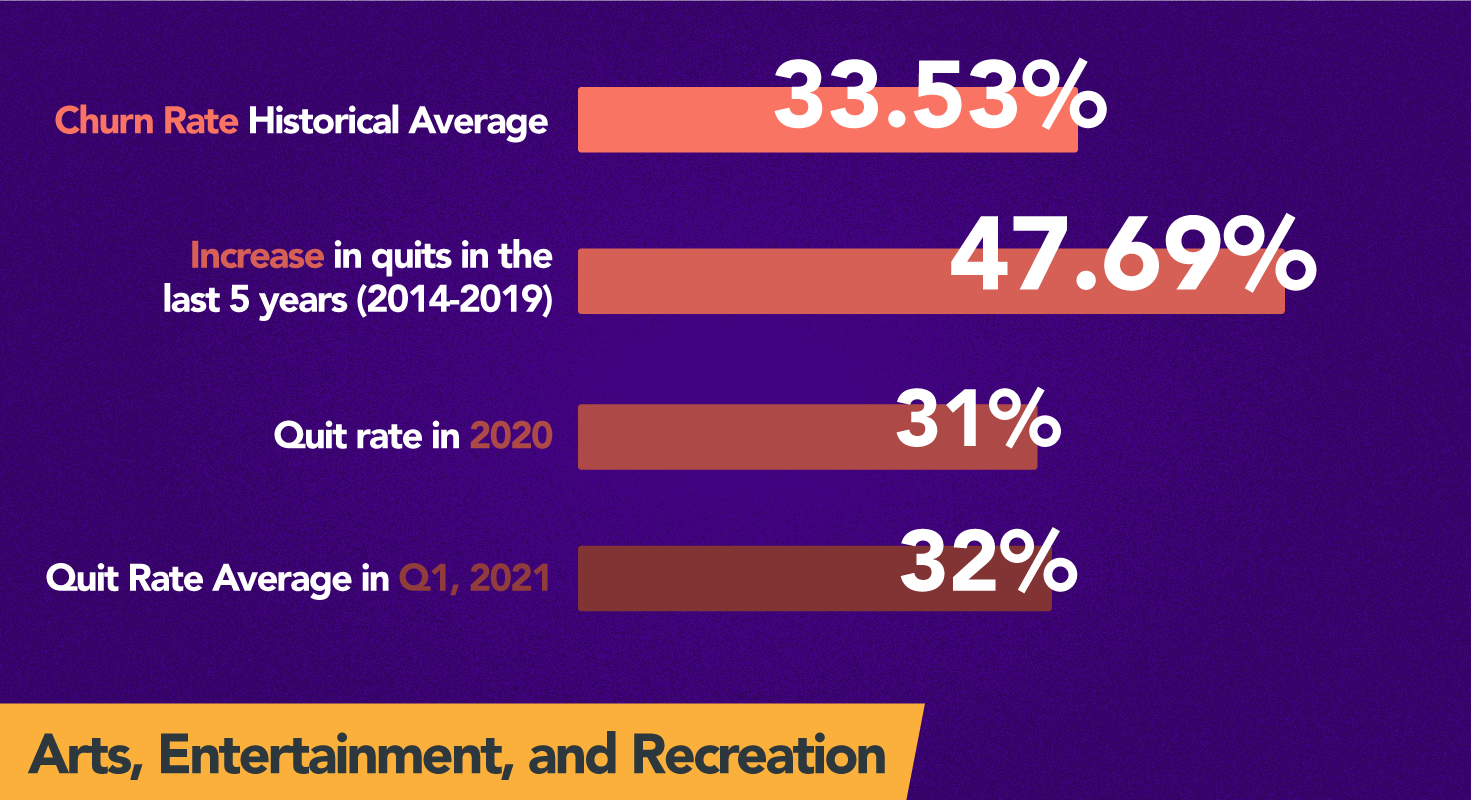
The Arts, Entertainment, and Recreation sector includes a wide range of establishments that operate facilities or provide services to meet varied cultural, entertainment, and recreational interests. For example, live performances, spectator sports, museums, amusement parks and gambling.
In Q1 2021, the rate of total separations was 72%, with voluntary separations, aka “quits'' making up 32% of the total separations count in the Arts, Entertainment and Recreation industry.
4. Professional Business Services
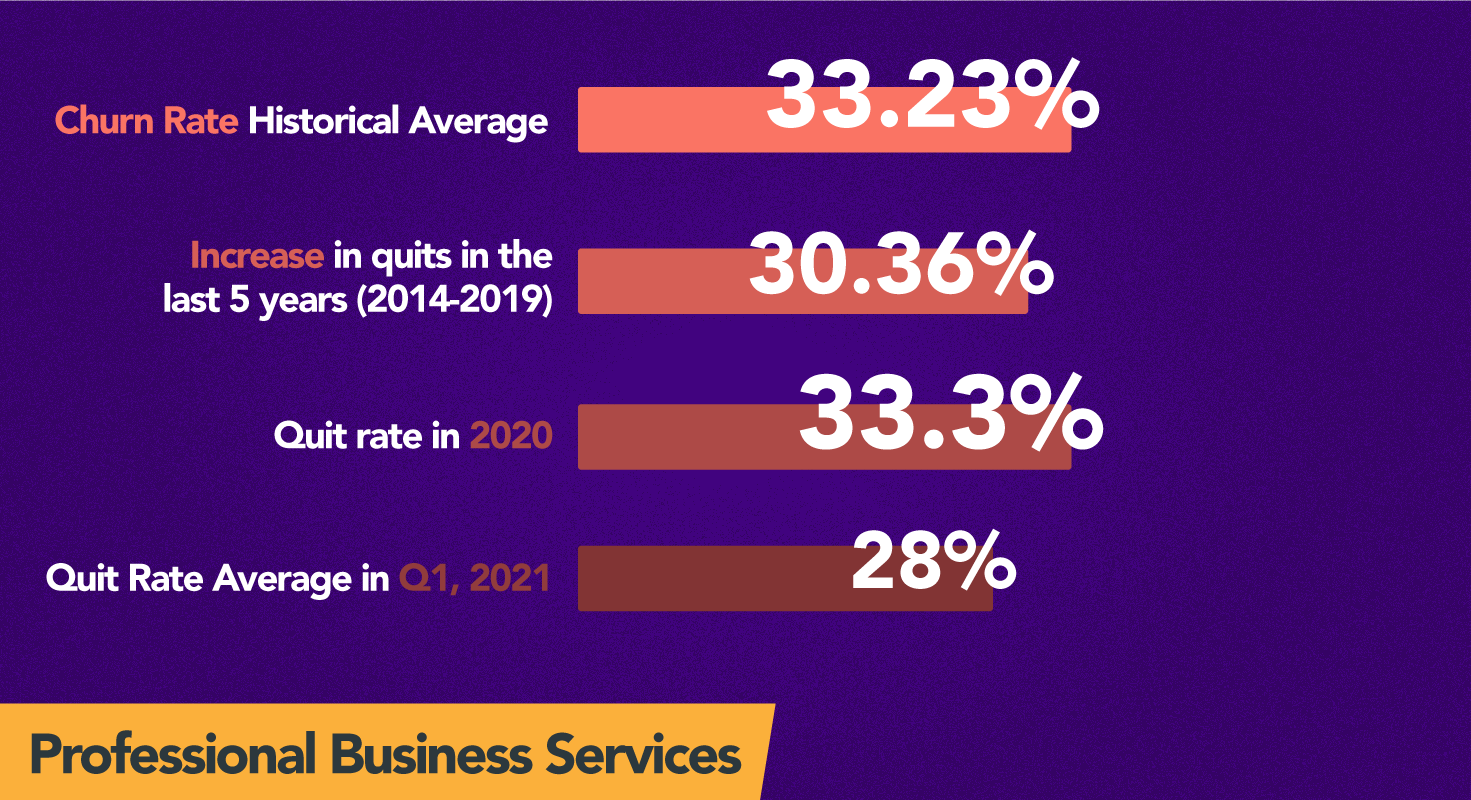
Professional Business Services is defined by BLS as professional, scientific and technical services, management of companies and enterprises and administrative support.
The historical average churn rate for Professional Business Services is 33.23%, just .30% less than Arts, Entertainment and Recreations.
What’s really interesting is the COVID pandemic affected Professional Business Services quit rates in 2020 greater than it affected Arts, Entertainment and Recreations, by a fairly sizable amount: 2.3%.
Despite the increase during the pandemic, Professional Business Services’ historical average and current Q1, 2021 stats place it at a lower churn rate than Arts, Entertainment and Recreation.
5. Construction
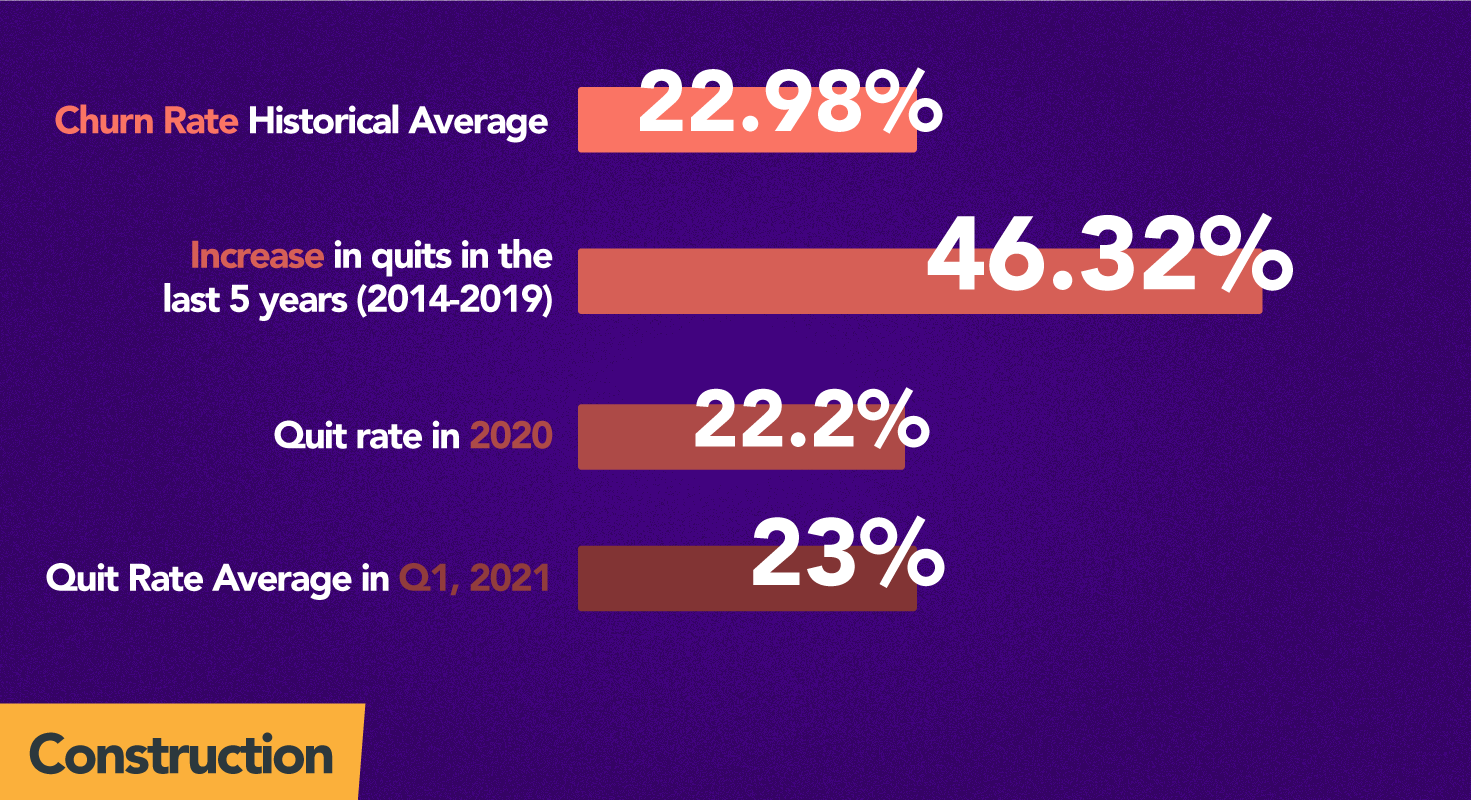
The construction sector is made up of establishments engaged in the construction of buildings or engineering projects like highways and utility systems.
Construction and Healthcare/Social Services have very similar quit rates historically, with less than a 2% difference between the two industries.
Healthcare did pop up above Construction during 2020 but in Q1 of 2021, we are seeing the industries level out to pre-pandemic rates with Construction returning to a 23% quit rate and Healthcare having a 22% quit rate.
6. Healthcare and Social Assistance
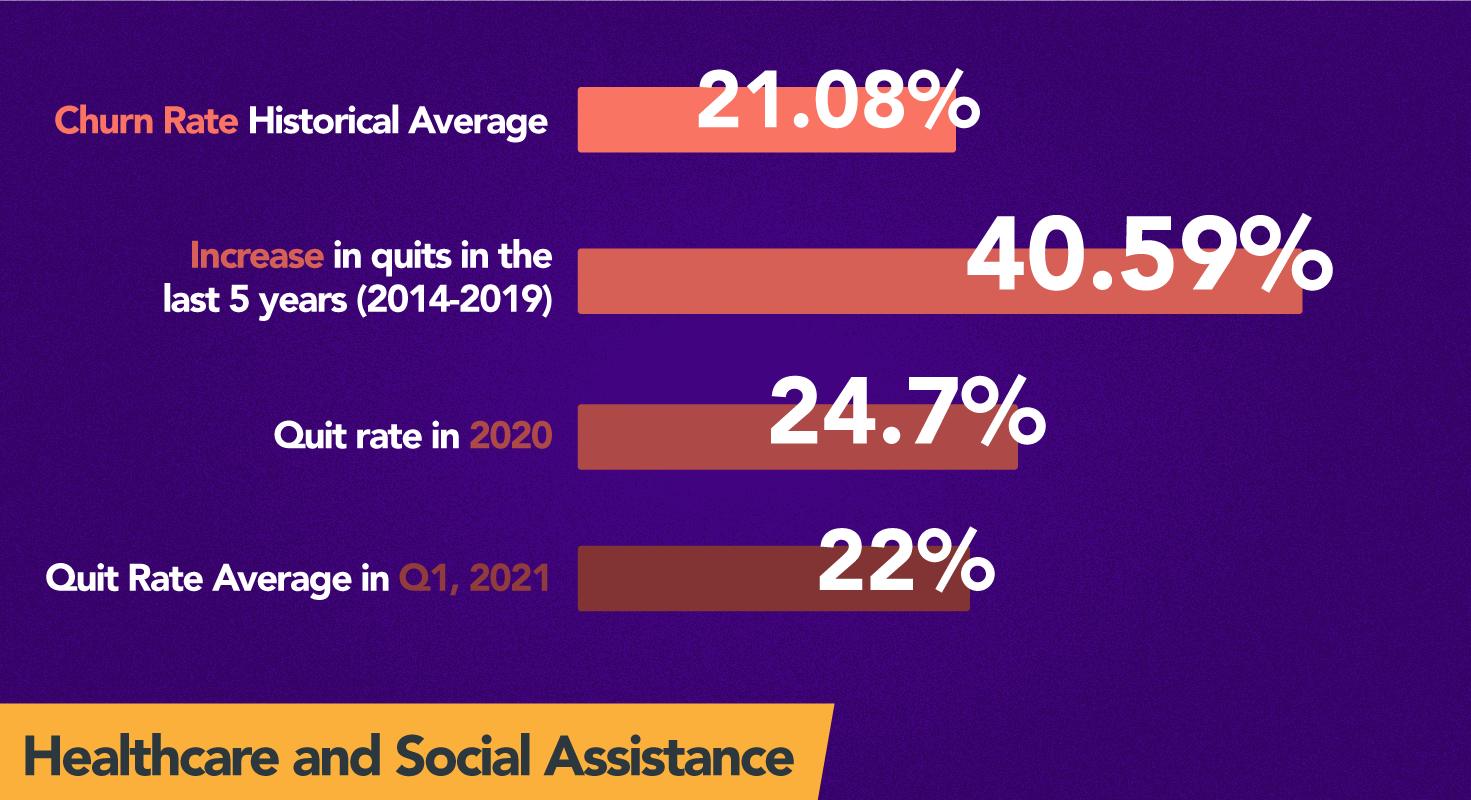
The establishments in this sector provide services performed by trained professionals for either medical care exclusively, health care and social assistance, or only social assistance. Examples are ambulatory health care services, hospitals, nursing and residential care, and social assistance.
As noted above, Healthcare/Social Services and Construction are two sectors with very similar quit rates.
Historically, there is only a 1.9% difference between the two industries. However, in 2020, Healthcare pulled ahead with a 2.5% higher quit rate than Construction. Q1 2021, is showing a trend towards pre-pandemic rates for both industries.
On an important note, there were only 5 industries (excluding the Government) that had an increase in quit rates between 2019 and 2020. Healthcare and Social Assistance was one of those industries, with a slight but significant change of 0.8%.
This is significant because, while the majority of employees in other industries were holding on to the jobs that they had, employees in Healthcare and Social Assistance were leaving at a greater rate. All this during a global medical emergency.
It’s worth speculating that the stress involved with these jobs during the pandemic may have increased the number of people quitting their job. Another observation—women make up 76% of the healthcare workforce and could be quitting in higher numbers due to increased childcare or family care responsibilities because of lockdown and social distancing.
7. Nondurable Goods, Manufacturing
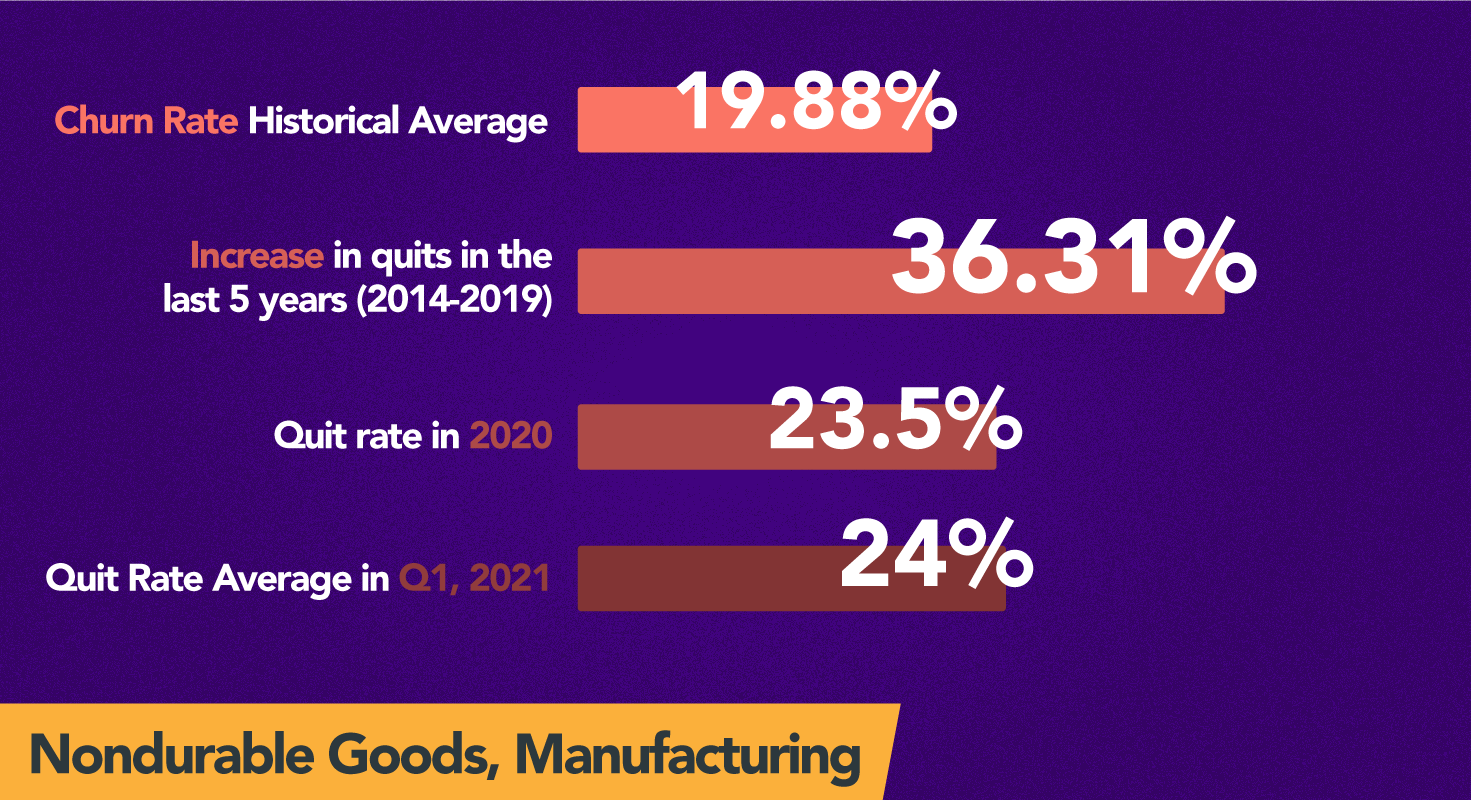
Nondurable goods is a subsector of Manufacturing. Companies in this industry sell items with an average life expectancy of fewer than three years. Examples would be merchant wholesalers of paper products, chemicals, drugs, apparel, footwear, flowers and nursery stock, and more.
This one is of specific interest because the voluntary quit rate increased between 2019 and 2020 by 2.62%. During the pandemic, when jobs were scarce and the US was looming with economic insecurity, people left their jobs in Nondurable Goods at a higher rate. This spike might be a reflection of an increase in COVID-related fear, a high number of infected workers, and mortality.
8. Other Services
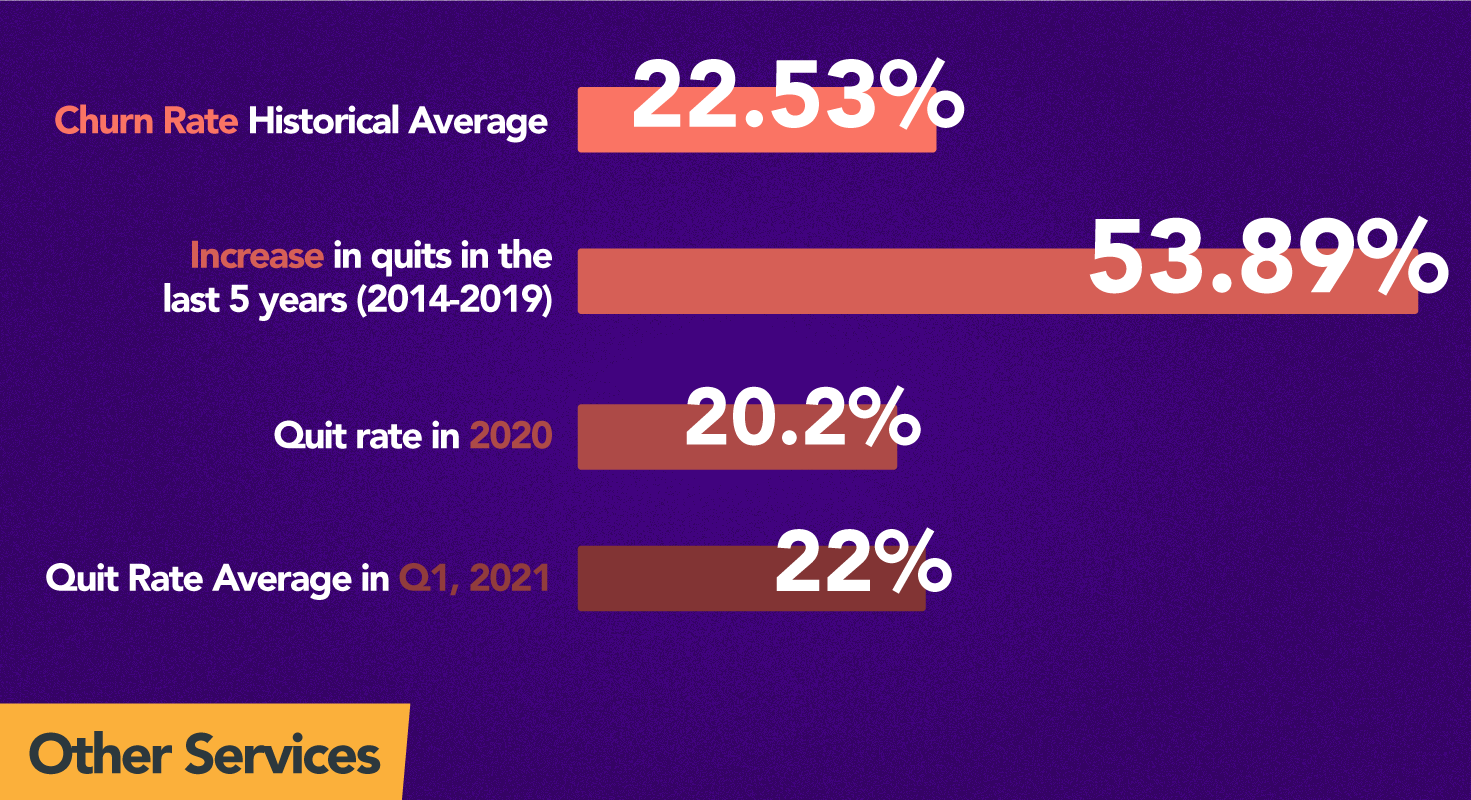
“Other services” is a catch-all for businesses engaged in providing services not provided elsewhere (except Public Administration). Activities such as machinery repair and maintenance, laundry services, religious, grantmaking, advocacy, personal care services like cosmetologists.
Only seven industries saw a decline in quit rates between their historical average and COVID 2020. “Other services” was one of the top three, with a decline (improvement) in quit rate of 2.33%
And was the top industry for a decline in quit rate between 2019 and 2020 at 7.4%.
9. Real Estate, Rental, Leasing
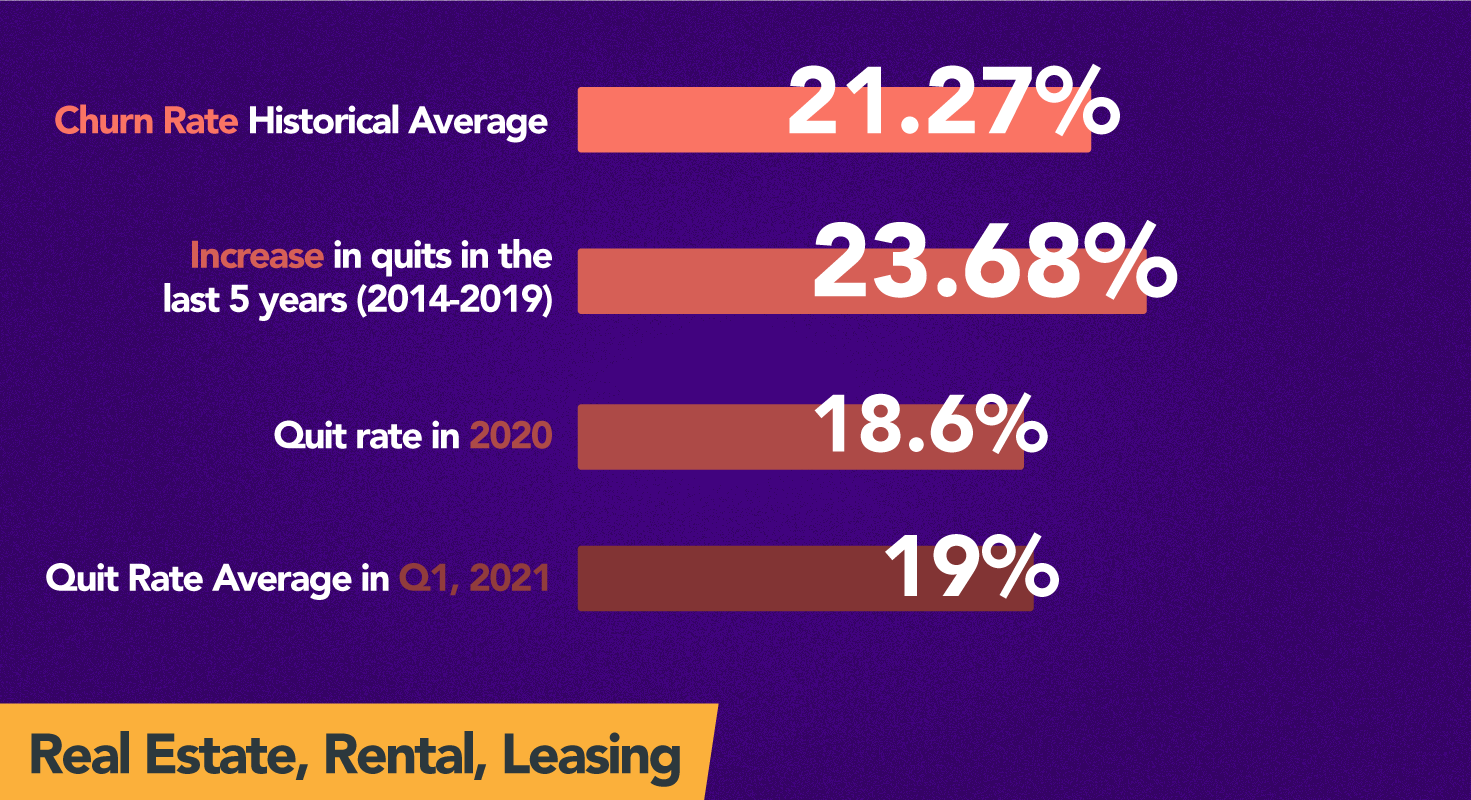
This category includes businesses primarily engaged in the renting, leasing, or related services of tangible assets, such as real estate and equipment, or intangible assets such as patents and trademarks.
Real Estate, Rental and Leasing is on trend to have a quick return to average quit rates, post-pandemic. From 2019 to 2020, there was a decline in quit rates of 4.9% and Q1, 2021 shows an average quit rate of 19%, approximately 2% less than the industry’s historical average of 21.27%.
10. Mining and Logging
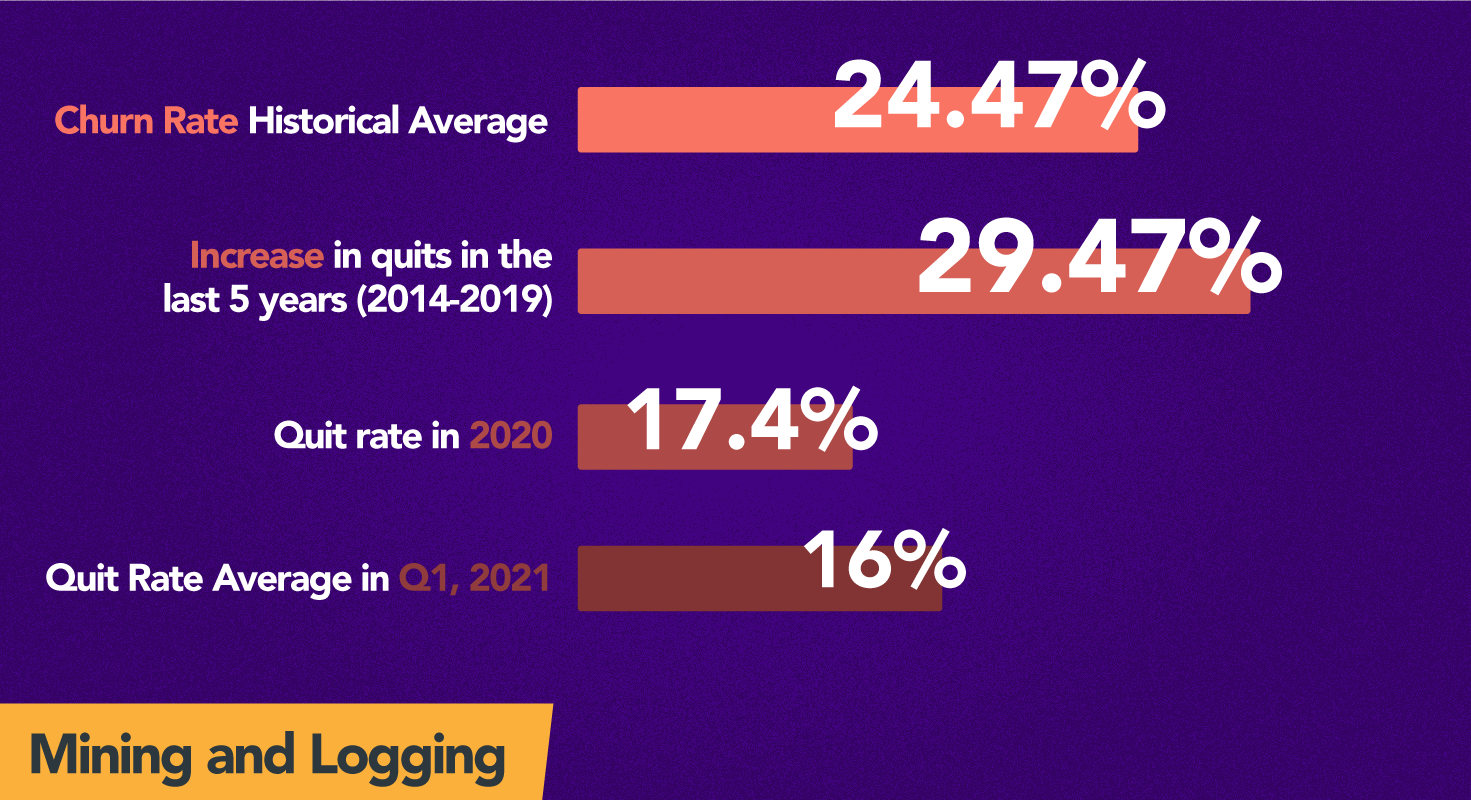
The term mining is used in a broad sense to include establishments that extract naturally occurring solid minerals, liquid minerals and gases. Including quarrying, well operations, beneficiating and other mining activities.
During COVID 2020, only seven industries saw a decline in quit rates compared to their historical average — Mining and Logging was at the top with the lowest quit rate. It had a decline (improvement) in quit rate by 7.07%.
Why Do People Leave Their Jobs
According to a brand new report by Microsoft Worklab, a shocking 41% of employees are considering leaving their employer this year (2021).
Which begs the question, who are these people and why are they leaving their jobs? Here are a few more interesting stats:
- 41% of employees are considering leaving their employer this year. (Microsoft Worklab)
- 1 in 4 Millennials (age 31 and younger) plan to leave their employers at some time in the next year — the highest among all generational groups. (Microsoft Worklab)
- One-third (37.9%) of new hires exit their organization within 365 days or less. Among this group, 23.2% said the reason to be“career development.” (Work Institute 2020)
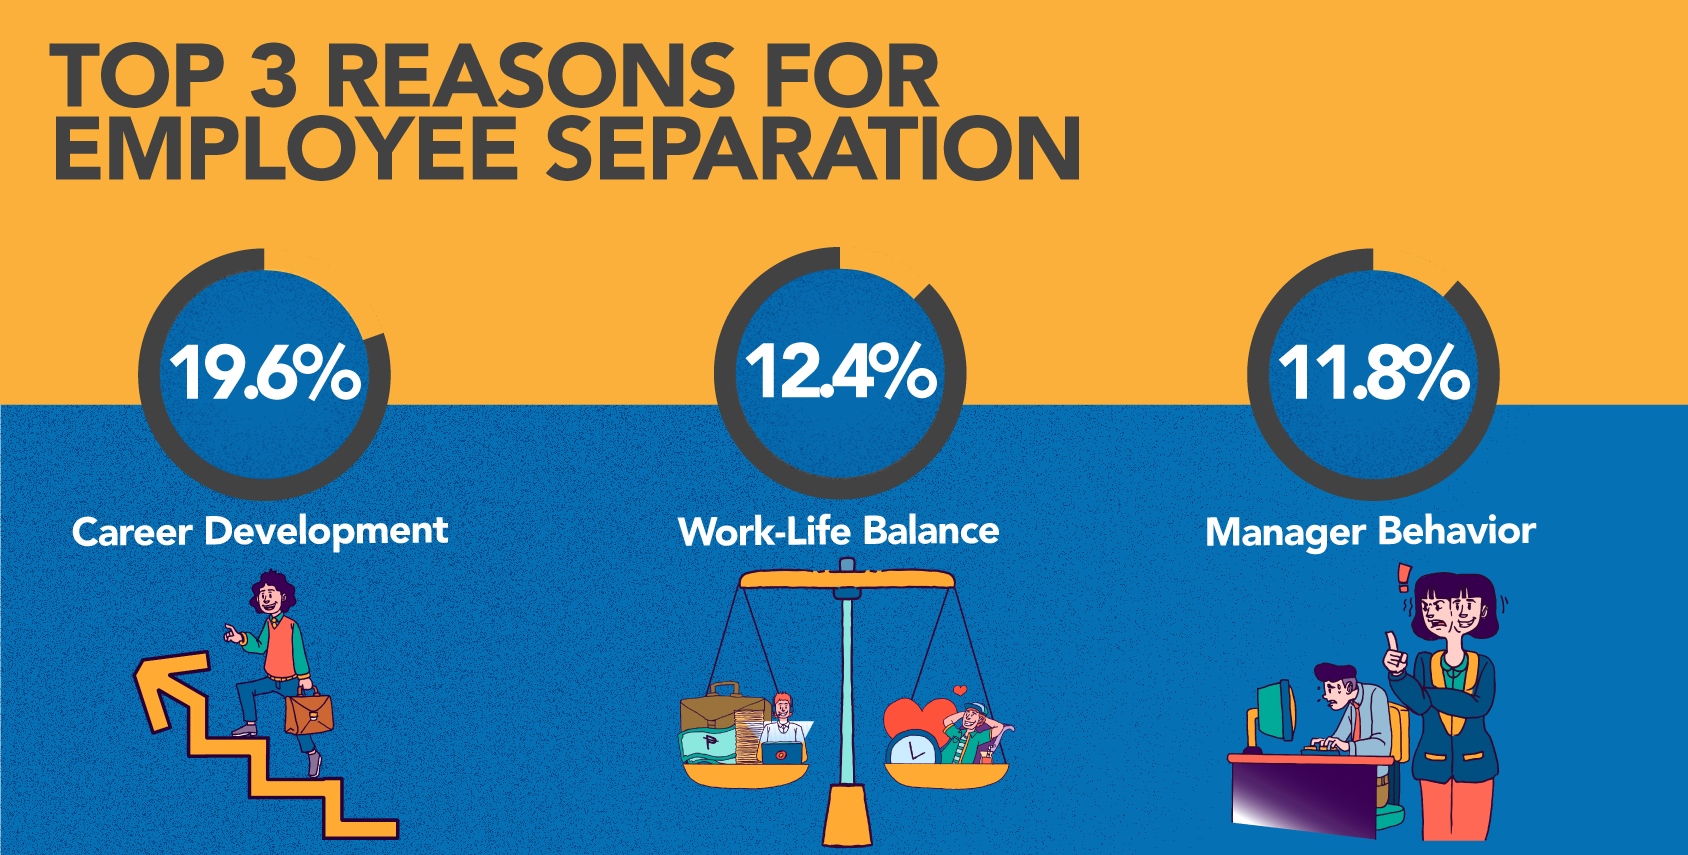
The Work Institute surveyed over 34k employees who quit their jobs in 2019 and found the following top three reasons for employee separation:
- Career Development (19.6%)
- Work-Life Balance (12.4%)
- Manager Behavior (11.8%)
Career Development
- Career development has been the #1 reason for ten straight years!
- Career development as a reason for resignation increased by 17% since 2013.
- 20 out of every 100 employees quit because of career development reasons in 2019.
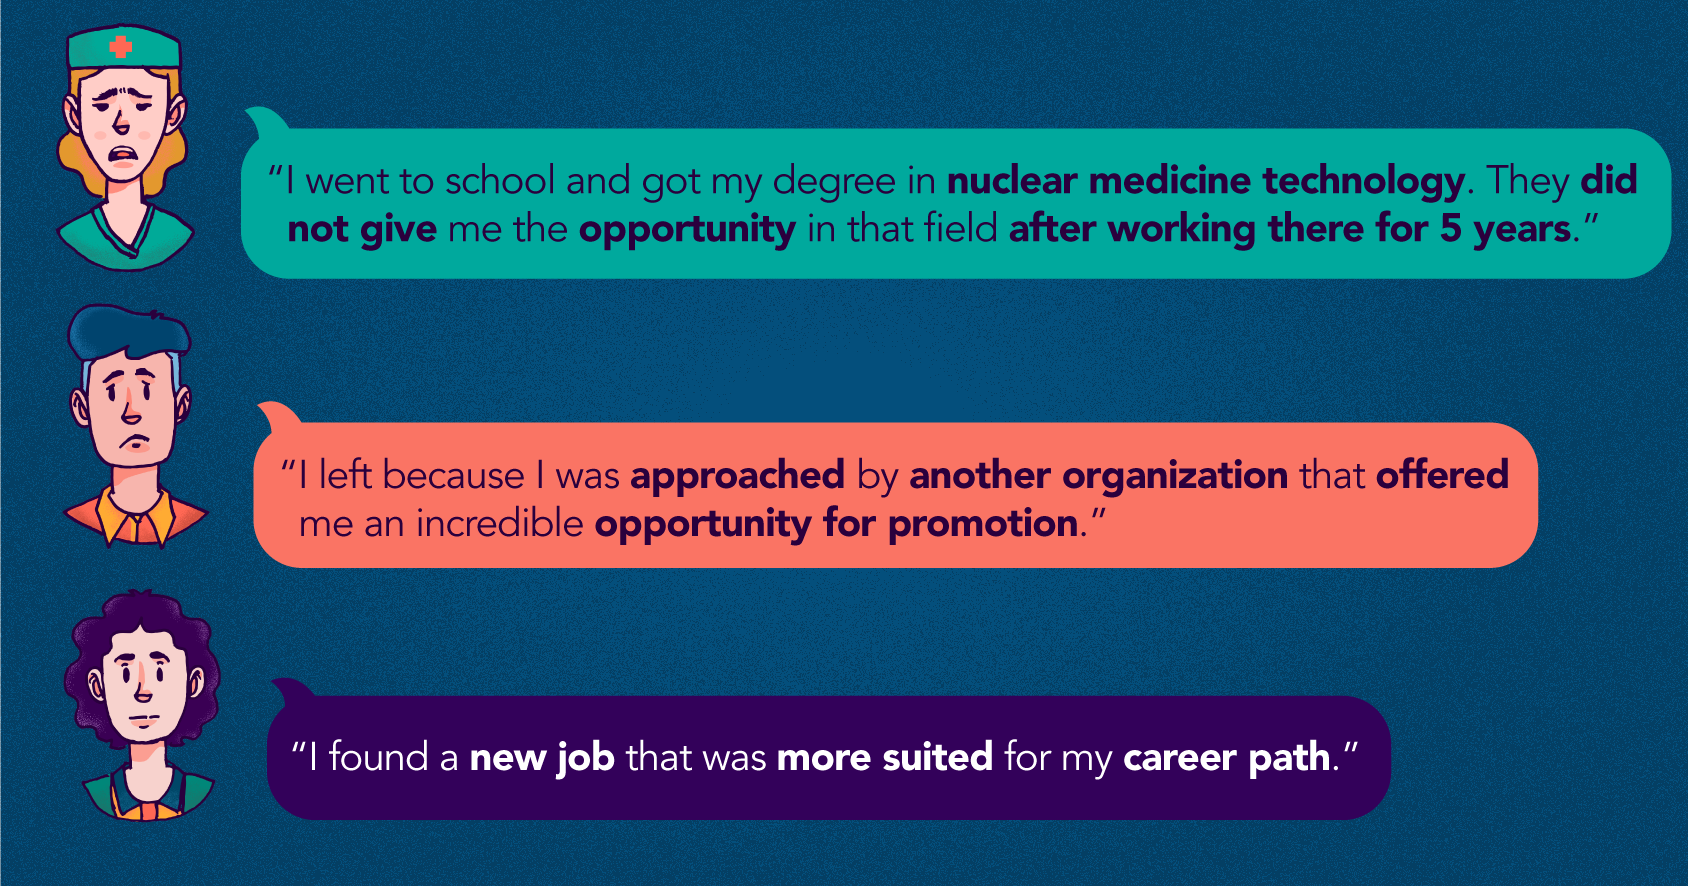
When you think about career development, you may immediately think of promotions. However, promotion and advancement as a subsection of this category have been trending down since 2010.
Career development is more commonly a grievance when it comes to personal growth and development — employees want to feel like their skill set is expanding and being put to good use.
Work-Life Balance
- Work-life balance is the second prominent reason employees quit.
- Since 2013, 23% more employees have quit due to this reason.
- 12 out of every 100 employees quit for work-life balance reasons.
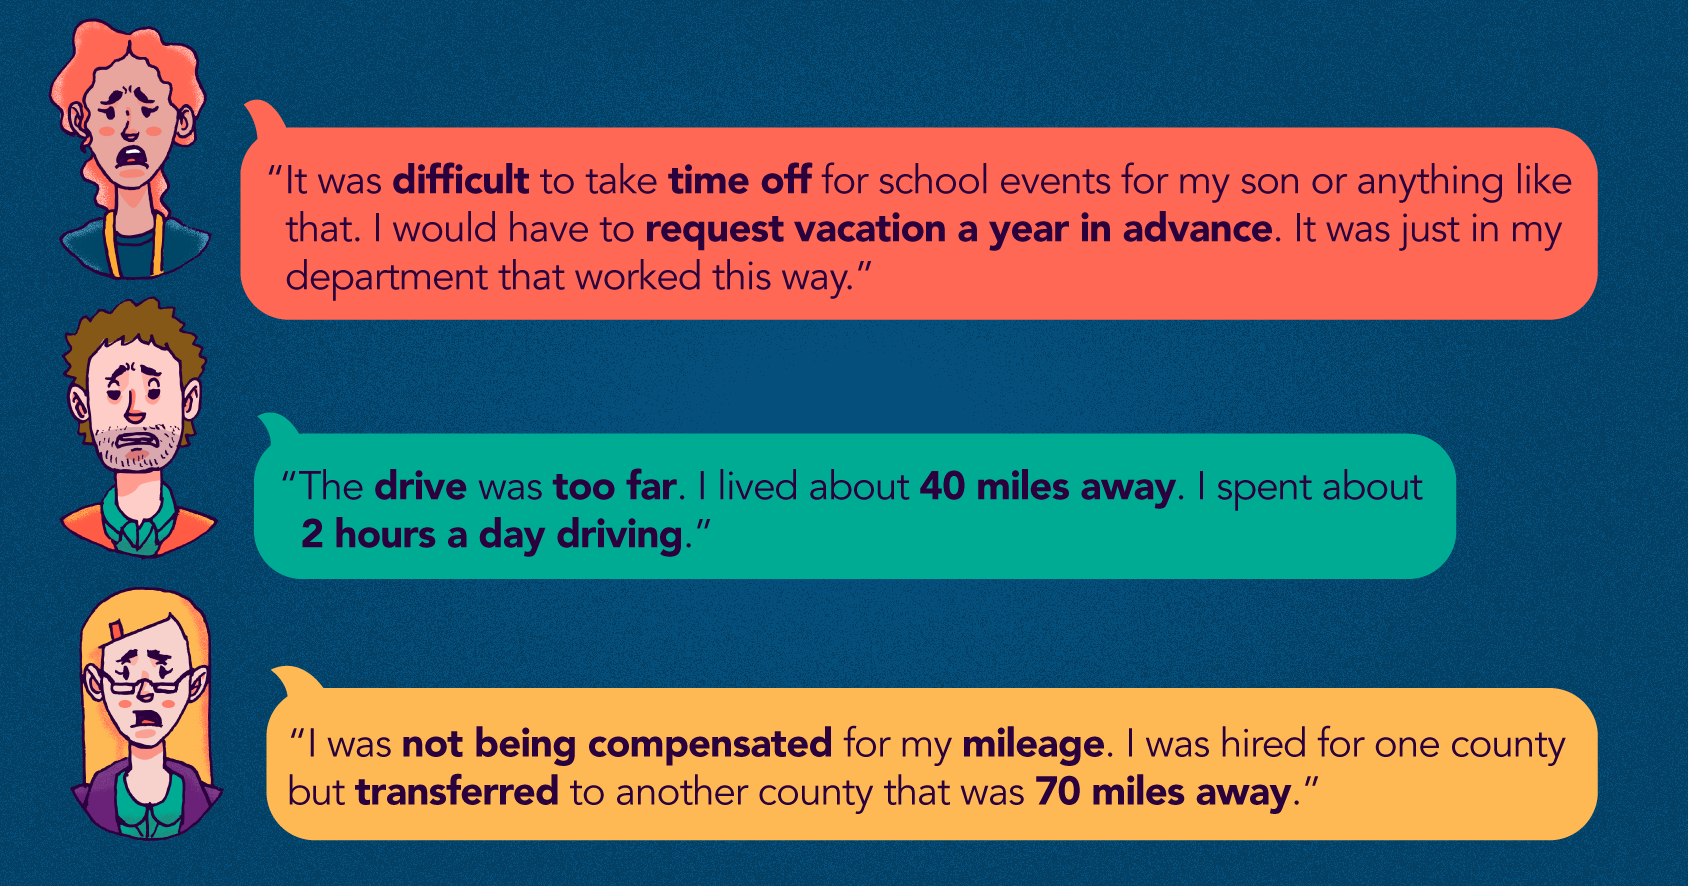
Within this category, the schedule remains the top-cited reason. Specifically, commuting time has increased by an astounding 334% since 2010, while schedule/flexibility continues to trend down, accounting for less than 1% in 2017, 2018 and 2019. Although post-pandemic, one can predict remote work options will surge in this category.
Manager Behavior
- Manager behavior ties work-life balance for the second most common reason for quits.
- 12 out of every 100 employees resign due to problems with manager behavior.
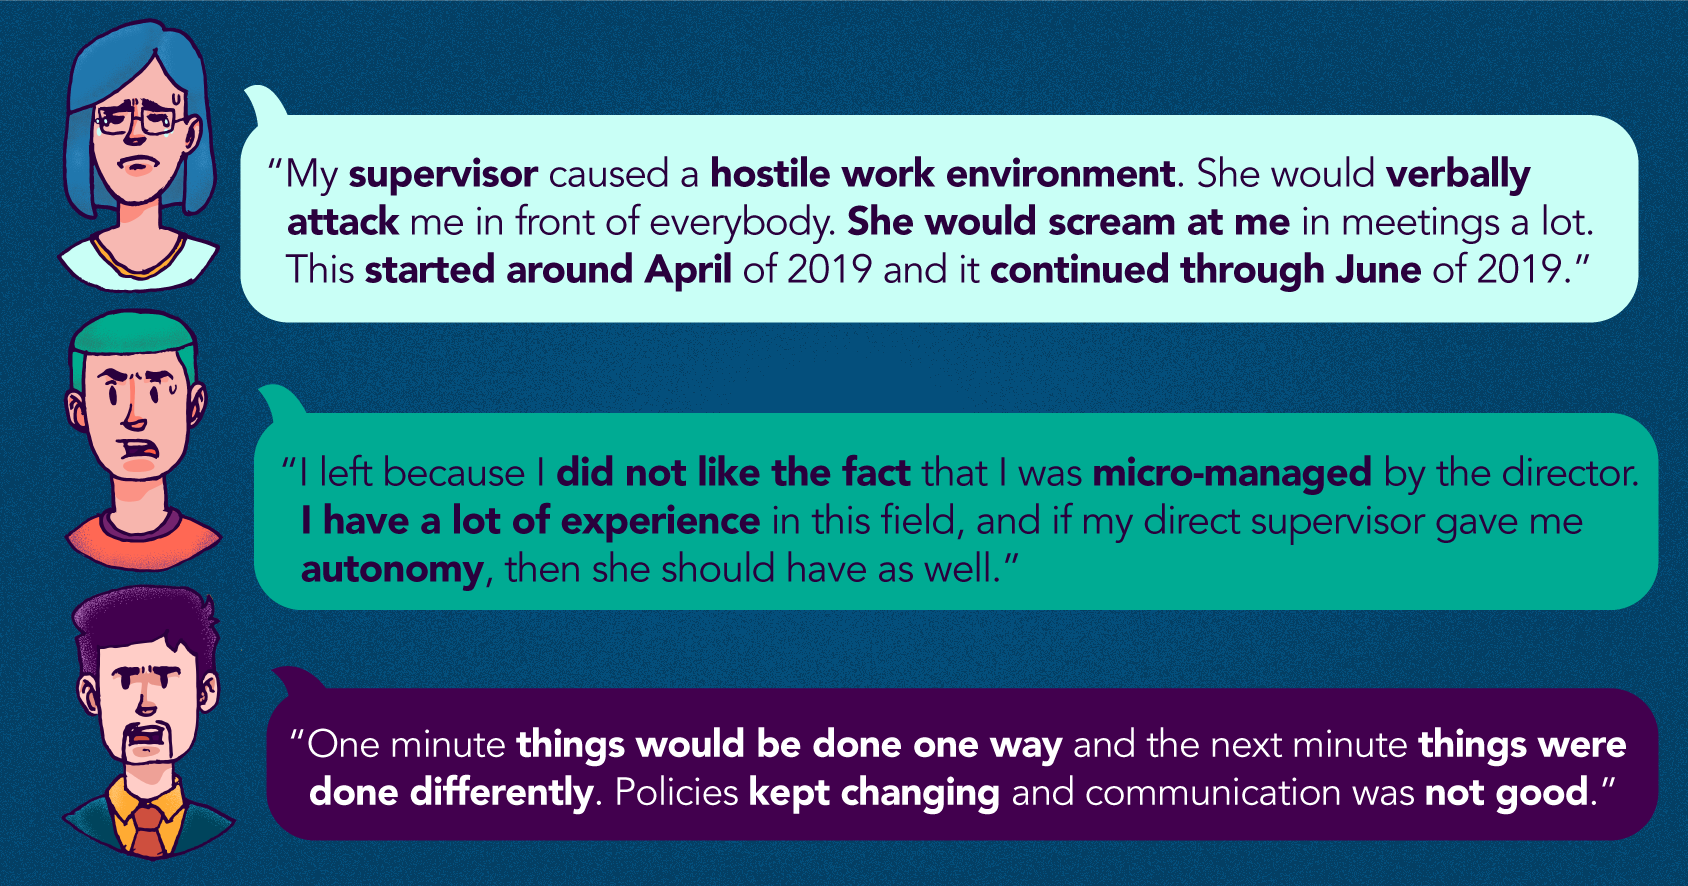
- Unprofessionalism remains the top reason under manager behavior.
Work Institute measured eight reasons under this category — only three out of these eight have improved in the last year i.e. unprofessionalism, upper management, and manager fairness. Unprofessionalism; however, still remains high, as the greatest reason cited for employee separation in this category
Employee treatment, general behavior, and communication have continuously gotten worse since 2017.
How Can You Fight Employee Churn?
In order to effectively fight employee churn, one must have a clear idea of why people leave their jobs but also what would make them stay.
According to the Work Institute, three out of four employee resignations could have been prevented. To fight employee churn, focus on challenging employees professionally, providing flexibility for a work-life balance, and offer ample compensation.
Career-Development
To fight employee churn due to career development, focus on training and succession because employees value meaningful work over any other retention initiatives.
- 42% of respondents seeking new employment believe their job does not make good use of their skills and abilities.
- 37% cited the lack of career progression as their reason for seeking other employment.
- 27% blame the lack of challenge in their jobs as the top factor influencing career decisions.
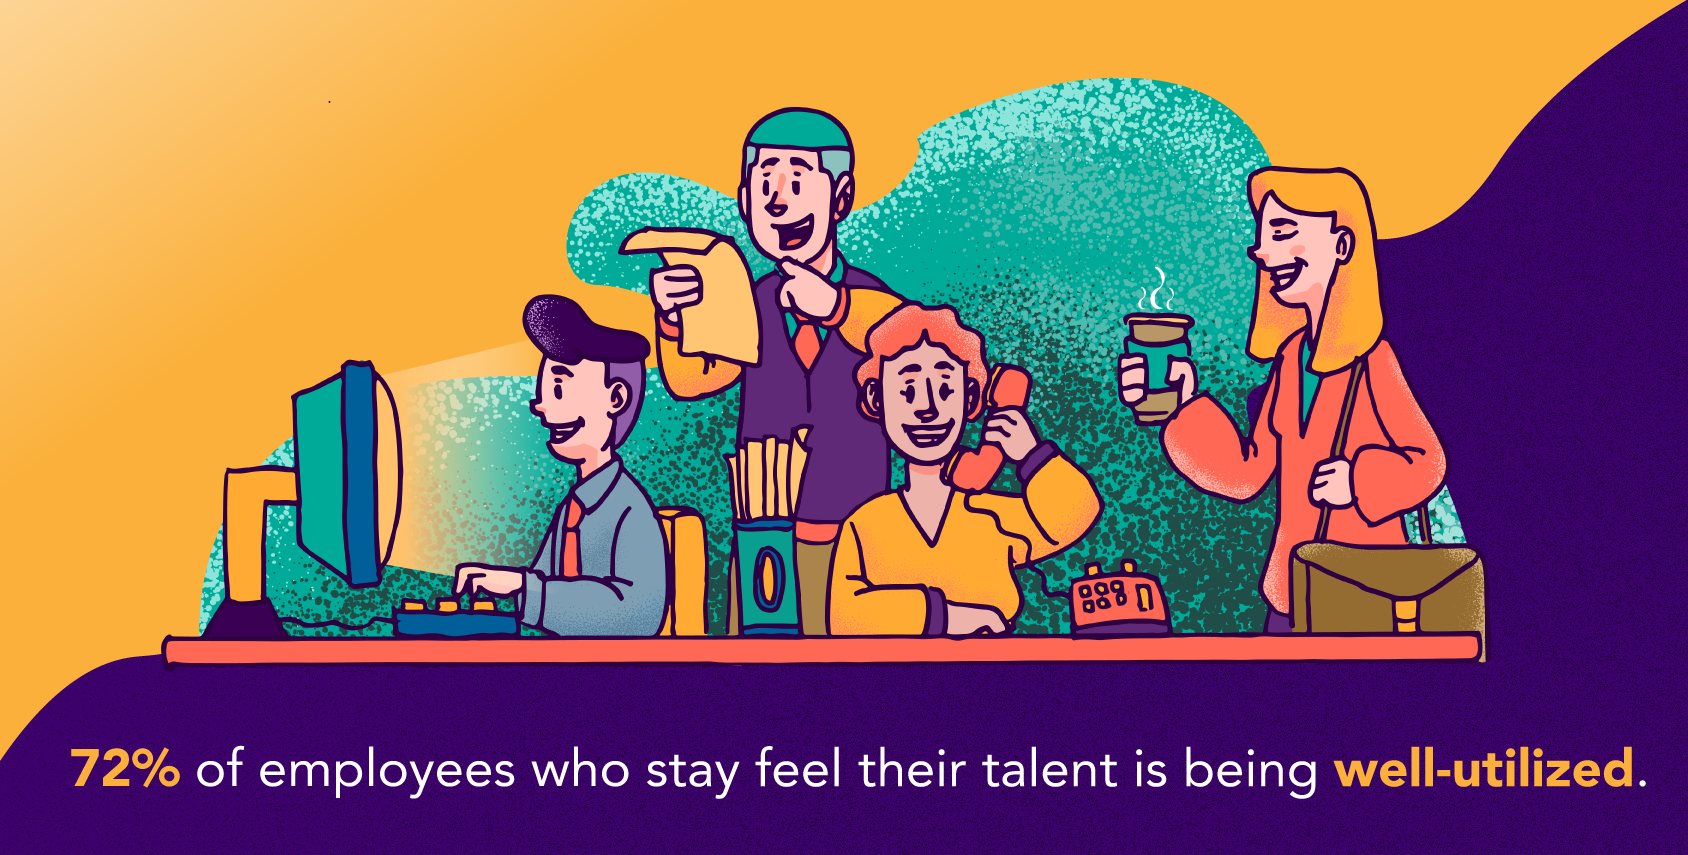
- However, 72% of employees who plan on staying with their current employer feel their talent is being well-utilized.
Work-Life Balance
To promote work-life balance, focus on creating hybrid work environments. Employees want the best of both worlds, especially now when they’ve experienced remote work. To prepare for this paradigm shift, 66% of business decision-makers are considering redesigning physical spaces to improve the post-pandemic workplace.
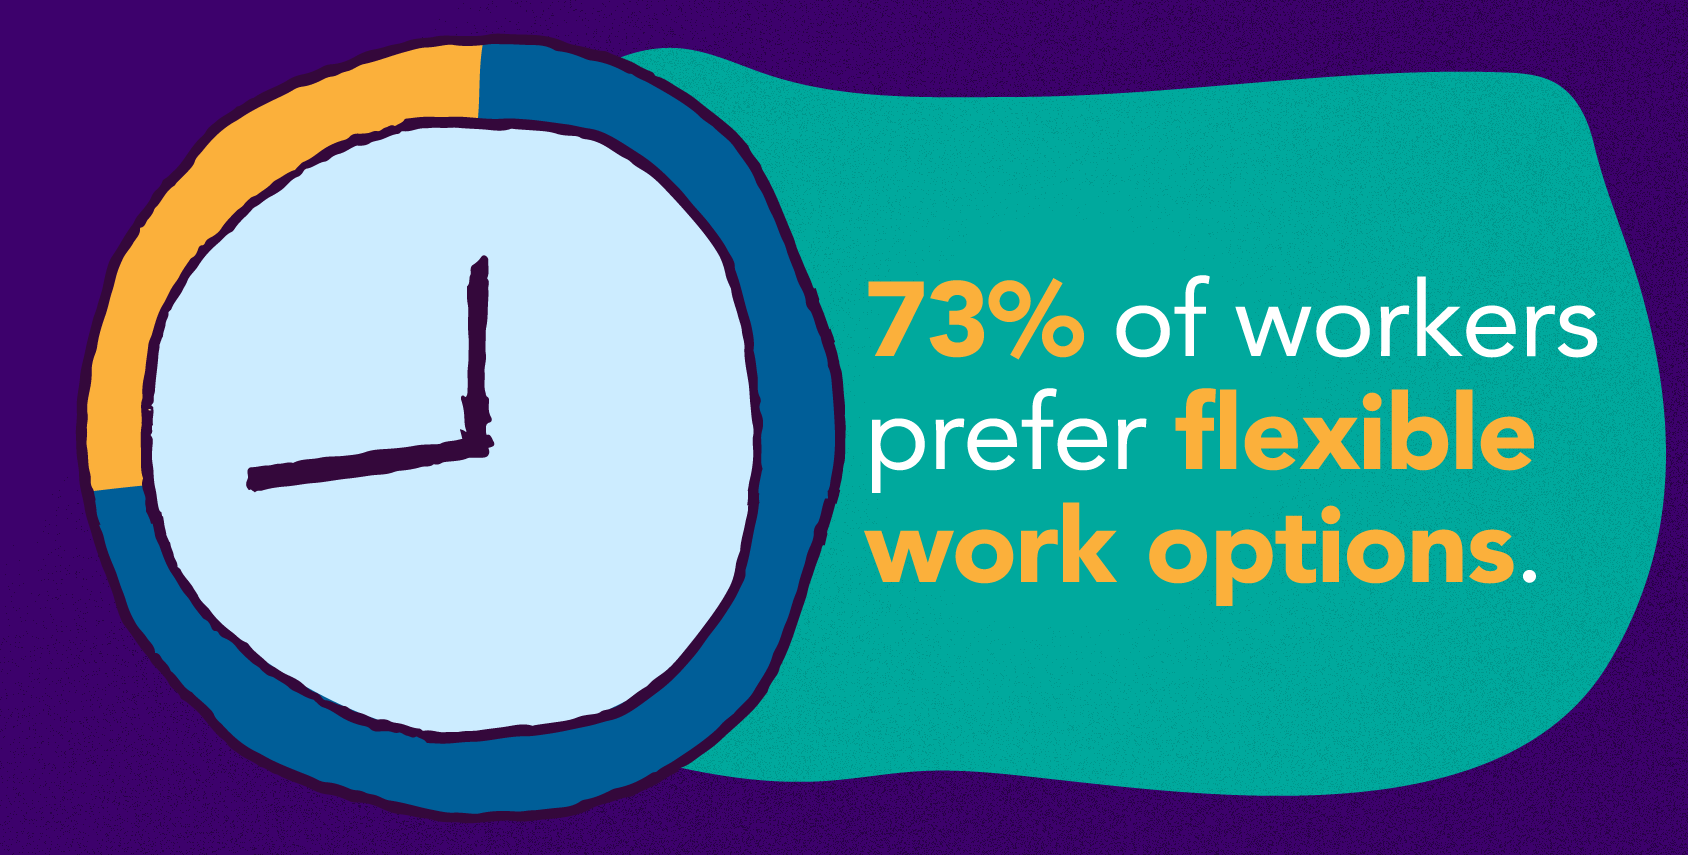
- 73% of workers want flexible work options to continue. (Microsoft)
- 57% of workers who reported their overall satisfaction as “strong” believe their companies are “world-class,” or “very good” when it comes to providing flexible work options. (Deloitte, 2020)
- 67% are craving more in-person time with their teams. (Microsoft)
- 1 in every 5 respondents says their employer doesn’t care about their work-life balance. (Deloitte, 2020)
Digital Overload
There was a shift in “work-life balance” when the pandemic brought many jobs home or otherwise created hybrid work environments. COVID changed how we all balance work and life.
Microsoft Teams dove into a specific subset of work-life balance, proving “digital overload” is real (and climbing). Following are some of their findings:
- 54% of people feel overworked
- 39% of workers feel exhausted
- Time spent in collaboration software (Microsoft Teams) increased by 2.5X and continues to climb
- 62% of calls and meetings are unscheduled or conducted ad hoc
- 50% of people respond to Teams chats within 5 minutes or less
To improve work-life balance in hybrid work environments, leaders will need to reduce employee workloads, embrace a practice of collaboration and create a culture where breaks are encouraged and respected.

Leadership
Trust in leadership is an incredibly important retention factor and critical component of job satisfaction. Only one in four employees who plan to leave trust their corporate leadership. To fight employee churn due to manager behavior, ensure the management is professional and communicates effectively.
- 55% of employees trust in their companies’ leadership. (Deloitte, 2020)
- 62% of Millennials trust their leaders, the most out of every other generation. (Deloitte, 2020)
- 70% of those who plan to stay, feel their organization has the ability to execute on its strategy. (Deloitte, 2020)
- 95% of employees who strongly trust their leadership, reported that managers communicate their company’s future plans effectively. (Deloitte, 2020)
Leadership Connection to Career Development
33% of all employees with a high level of trust in leadership also rate their corporate talent programs as “world-class,” compared to just five percent of all survey participants.
On the other hand, of the surveyed employees who expressed little confidence in their company leadership, 89% reported that their organizations’ overall talent efforts were “poor.”
As the statistics above reveal, it’s not too difficult to reduce quit rates. Taking the time to learn why a person would stay or leave will greatly slow down employee churn.
Businesses should consider having a dialogue with workers or get regular feedback from employees to better understand what categories need improvement. By taking these steps, businesses can avoid the costly consequences of high employee turnover and retain top talent.


