
Metrics and KPIs track many aspects of your call and contact center: agent performance, inbound activity, customer satisfaction, staffing needs, and more.
There are hundreds of potential call center metrics, but which ones are the most important?
This article will outline the 22 most important call center metrics and KPIs, including why they matter and how you can track them.
22 Most Important Call Center Metrics
1. First Call Resolution (FCR)
First call resolution rate measures how often an agent can resolve a customer’s query in the first interaction. A higher first-call resolution rate increases customer satisfaction and customer loyalty. Poor first-call resolution usually stems from customers being routed to an unprepared agent.
The best ways to boost your first call resolution rate are to ensure that agents have all the tools they need to provide effective live support, and to optimize your routing strategy so that customers reach the agent best suited to help them. Tools like IVR and skills-based routing provide agents with customer context and route customers to the right agent.
2. Average Speed of Answer (ASA)
The average speed of answer (ASA) tracks how quickly an agent answers a call once it enters the agent’s queue. If the ASA is too long, the customer becomes more likely to get frustrated and hang up. Measuring the ASA can help you determine if agents need to increase efficiency or expedite wrap-up time, or if your call center needs more staffing at certain times.
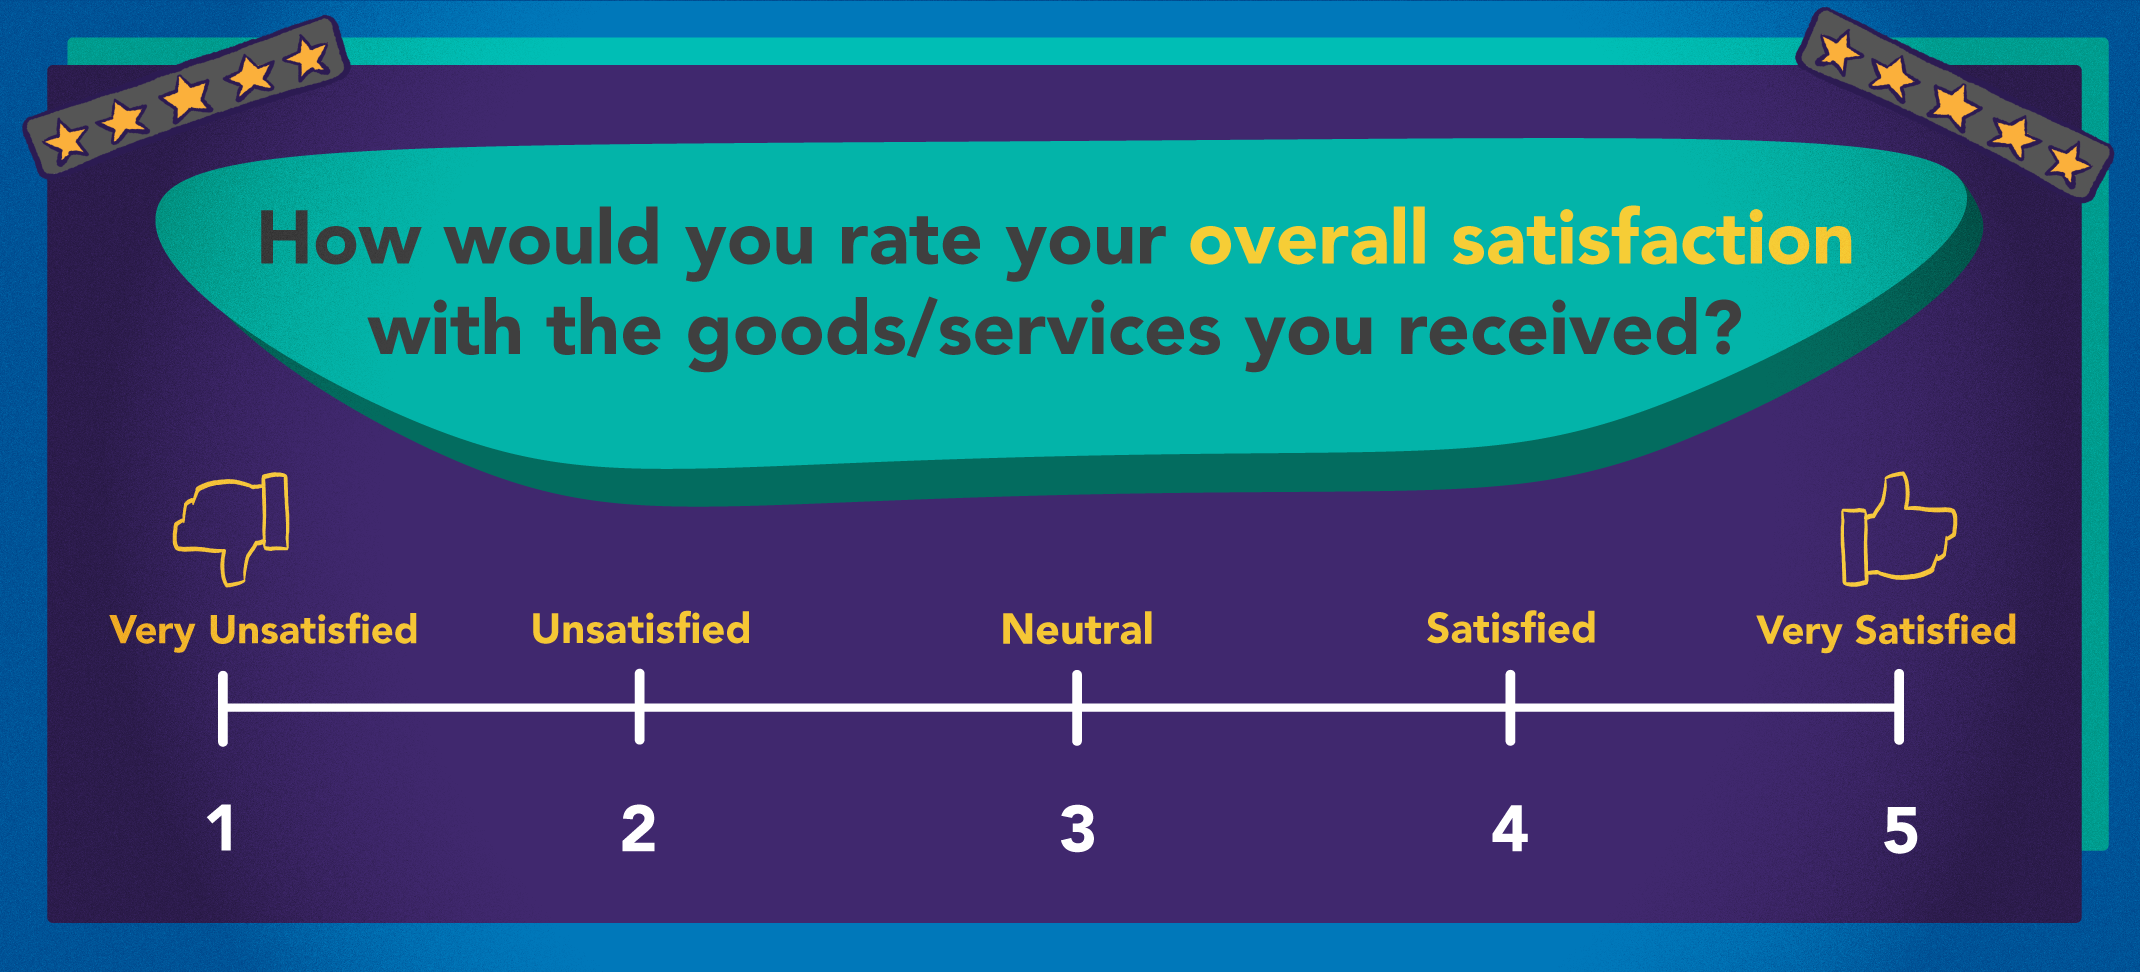
3. Customer Satisfaction Score (CSAT)
Customer satisfaction score is a survey-response metric measuring a customer’s contentment with a product or service. A CSAT score is one of the most well-rounded customer-service metrics because it reflects the customer’s overall attitude toward and relationship with your company
Most call centers determine a CSAT score using an interaction follow-up survey asking “How satisfied were you with today’s service?” followed by a 1-5 or a 1-10 scale. Prompt customers to elaborate with a sequence of questions about more specific parts of the customer’s experience.
CSAT scores are useful for evaluating agent performance, overall customer sentiment, and the quality of your product.
4. Net Promoter Score (NPS)
Net promoter score (NPS) is a survey-style metric of your customer’s likelihood of recommending your brand or company to others. Similar to the CSAT, NPS scores are gathered via survey, asking customers “How likely are you to recommend [product or service] to others?” followed by a 1-10 scale.
Customer responses are classified by their survey responses:
- Promoters score 9-10, those most likely to spread awareness about your company
- Passives score 7-8, those more likely to offer lukewarm or occasional referrals
- Detractors score 0-6, those with a high rate of churn who often harm your company’s reputation
Like CSAT scores, you can follow up this initial question with more specific ones, to gain a detailed view of your customer’s perspective and experience with your company or product.
5. Customer Effort Score (CES)
Customer effort score is a survey-style metric measuring how easily your customers interact with your business, service, or product. This includes how smoothly customers can navigate customer support interactions, contact your company, and use your product or service.,
Like CSAT and NPS, the customer effort score is collected via a survey prompt that customers answer using a scale, indicating the extent to which they agree with a statement like “It was easy to contact customer service today.”
To improve CES, consider ensuring that agents are available during peak call traffic times, and provide your customers with multiple communication channels through which they can reach you.
6. Customer Churn Rate (CCR)
Customer churn rate (CCR) is the percentage of your customers that cancel or discontinue their subscription within a given time period. Since each business’ product is different–ranging from standalone products to monthly subscriptions–you first must define what your organization considers to be a lost customer.
To determine your target CCR, look to your competitors–a reasonable goal is to have a lower churn rate than all competitors. Alternatively, you can simply aim for a lower CCR each successive year or month. In conjunction with the metrics above, CCR offers a great proxy for how satisfied your customers are. If you face a high CCR, aim to determine why customers are leaving your company for competitors.
7. Customer Retention Rate (CRR)
Customer retention rate (CRR) measures the percentage of your customers that you retain over a given time period. The opposite of CCR, a high retention rate indicates satisfied customers, increased revenue, and typically a high net promoter score as well.
Like CCR, determine your goal retention rate in relation to your competitors and previous percentages–aiming to have the highest in your industry, and more than your previous marks. If you find your CRR dropping, consider what changes may have caused customer friction–such as a lack of staffing, a low first-call resolution rate, or a disliked change in your product or service.
8. Cost Per Call (CPC)
Cost per call (CPC) measures the average cost of each call your business makes.
Calculate your CPC by adding up your total contact center expenses–hardware, phone service subscriptions, training, agent salaries, and benefits–and dividing these by the total number of logged call minutes over a given time period, such as a month. You can calculate the cost per call for the whole contact center, or for individual agents and queues.
While it might seem tedious, CPC provides holistic data in regard to your contact center’s ROI and efficiency. By comparing your revenue per call with your cost per call, you can determine if your agents, queues, and call center are making efficient use of call time.
9. Percentage of Calls Blocked, or Missed Call Percentage
The percentage of calls blocked measures how many inbound calls are sent to voicemail because no agents are available. When your call center queues reach a preset threshold–or when there are no available agents–you can automate the phone system to route inbound calls to a busy message.
These blocked calls still show up on call logs, allowing you to calculate the percentage of overall calls that get blocked. It’s ideal to keep this number below 2% since customers understandably become frustrated when they receive a busy tone.
10. Average Handle Time (AHT)
Average handle time determines the mean amount of time an agent spends on a call–including talk time, hold time, and post-call work like notes and records. To calculate the average handle time for the entire contact center, add each agent’s talk time, hold time, and wrap-up time, and divide this sum by the number of total calls.
This metric is useful when evaluating agent efficiency, as agents with a lower AHT typically provide quicker task resolution and follow-up. Customers prefer quick issue resolution–and you want to maximize all of an agent’s work hours–so it’s important to aim for a quick AHT combined with a high first-contact resolution rate.
11. Average Call Occupancy Rate
Call occupancy rate averages how much of an agent’s work time is spent active vs idle. Also known as “agent utilization rate,” occupancy rate provides important information about call center staffing needs. Too low of an occupancy rate indicates that you may have too many agents, while too high of an occupancy rate may indicate an understaffed call center and overwhelmed agents.
Further, you can compare occupancy rates for various queues and agents to see if certain departments or queues are overstaffed or understaffed.
12. First Response Time (FRT)
First response time measures how long it takes an agent to answer a call once it gets placed in their queue. FRT serves as a proxy for call center activity and staffing needs–a long response time indicates that queues are full and may require support–as well as a customer-service metric.
Customers expect to connect with an agent quickly–if not instantly, then within a few minutes at most. If your average first response time extends beyond 2 minutes, consider adding more call center agents at busy times of the day.
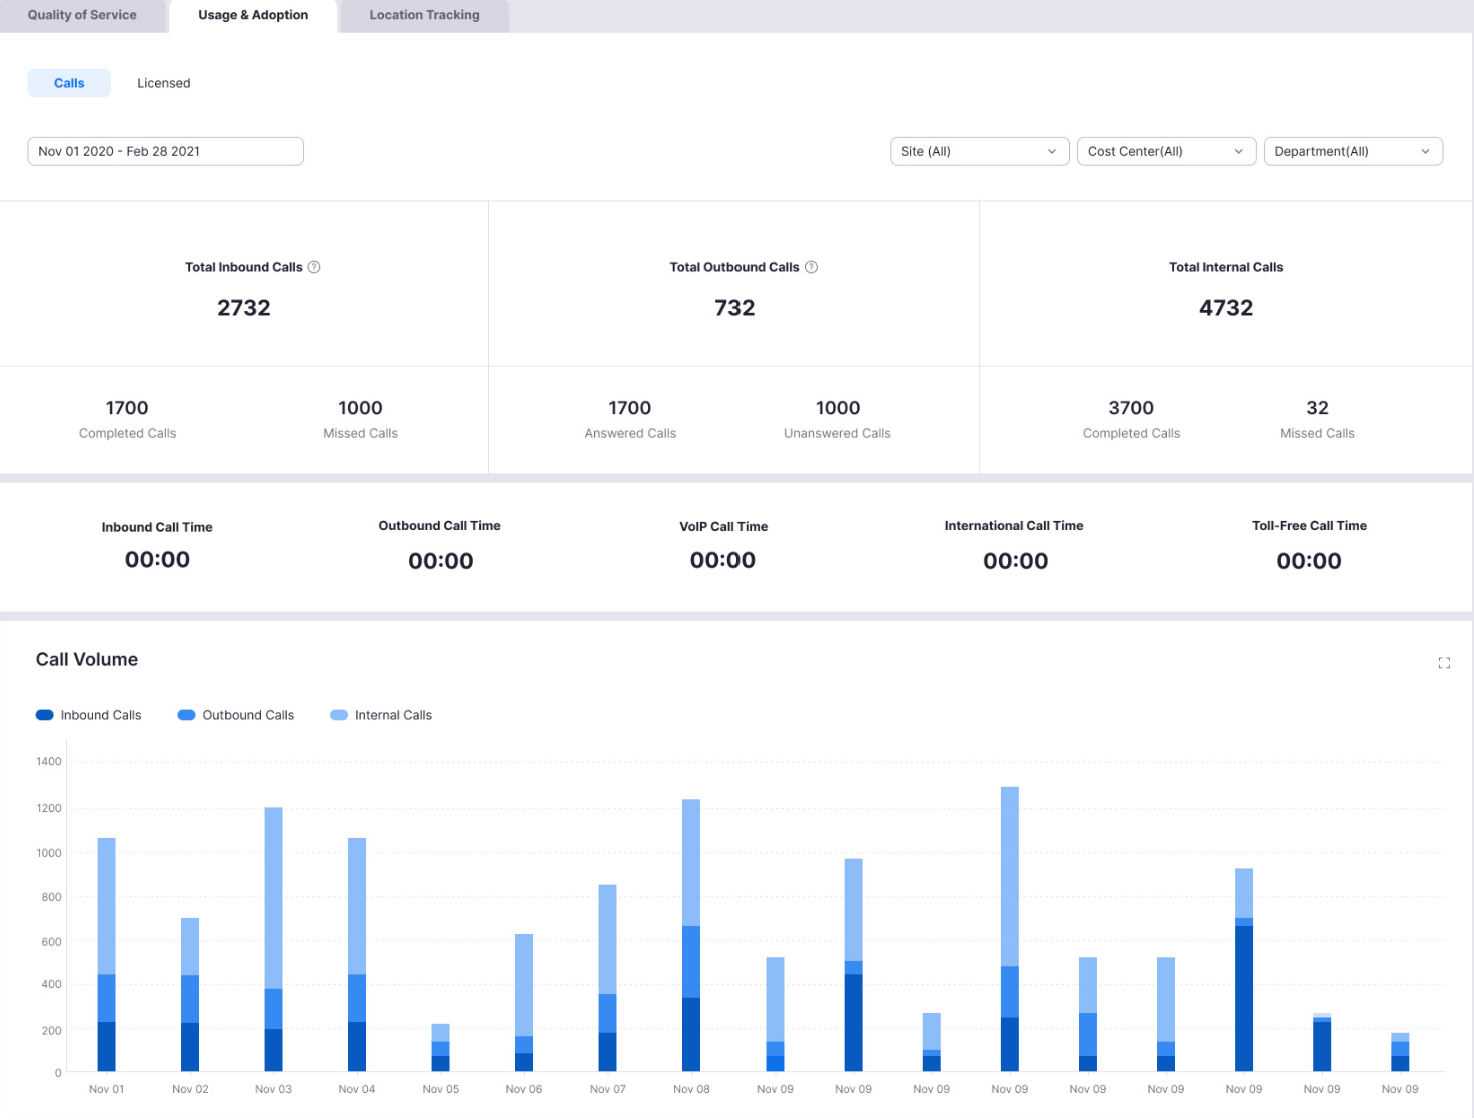
13. Call Traffic by Time of Day and Weekday
Call center traffic refers to the number of calls your call center receives during a given time period–such as an hour, day, week, or month. Tracking your call center’s inbound traffic over various time periods is helpful to forecast staffing needs, for the hours, weekdays, and seasons that require the most agents on call.
Many cloud-based phone systems and UCaaS platforms include analytics that track call activity–customizable for any user, queue, and time period you choose–including heatmaps that visualize the most active times of the day. You can also track call traffic manually, by adding up the total number of calls in the call log during that time period.
14. Call Availability
Call availability measures the percentage of time agents are actively available to take calls while working. In other words, it measures an agent’s idle or standby time–that which isn’t occupied by an active call, call follow-up, or a break.
Most VoIP phone systems and UCaaS platforms let agents log and display their availability and on-call status with a button icon. Many analytics systems track call availability, and it’s helpful to note your call center’s availability for each hour of the day, day of the week, and month. Calculate your call availability by subtracting the occupancy rate from 100–the remaining value is your call availability percentage.
15. Average Time in Queue
The average time in the queue measures how long a customer has to wait in line once they enter a call queue. Virtually the same thing as the average speed of answer (ASA), time in queue is useful to determine staffing needs for individual queues and the contact center as a whole. Ideally, a customer has to wait no more than one minute in the queue, on average.
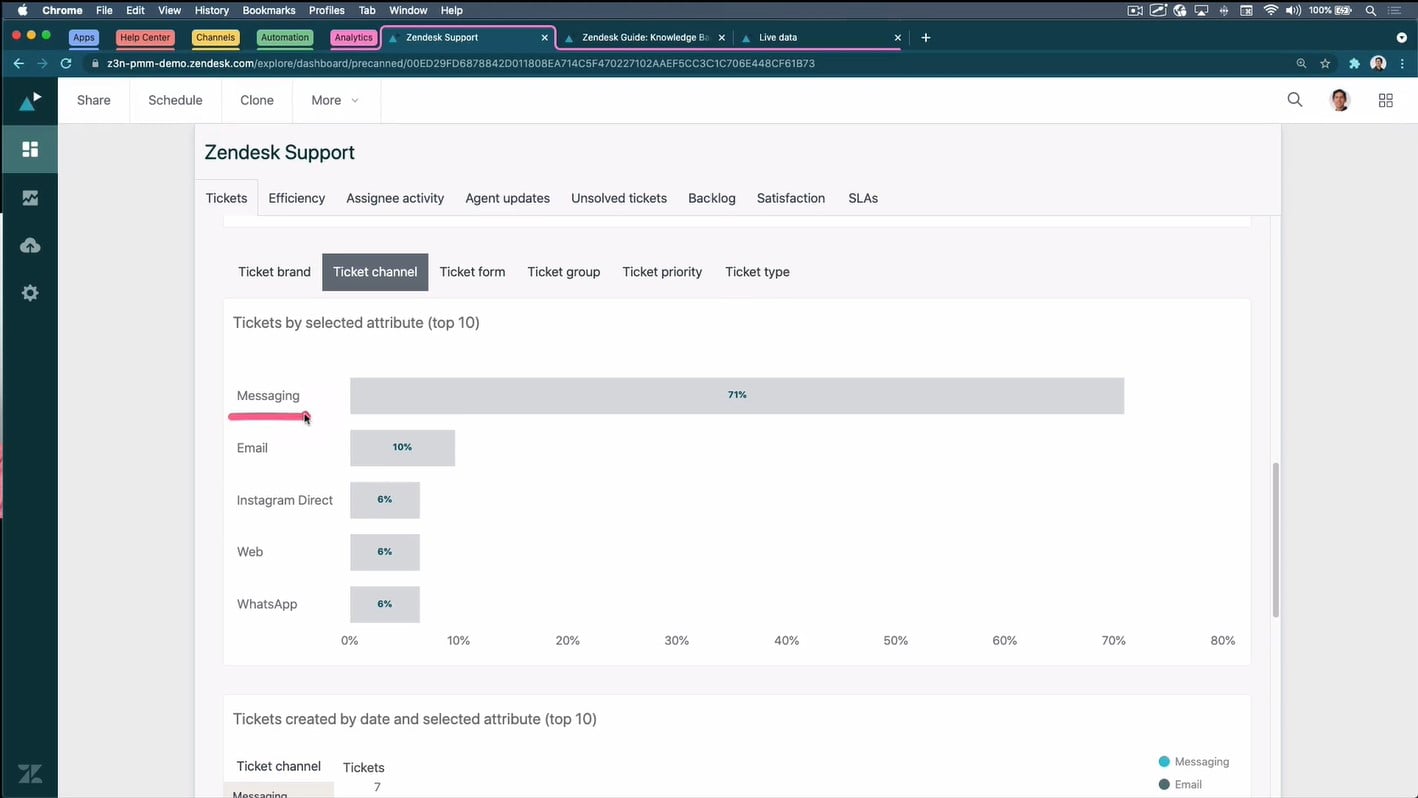
16. Channel Mix and Activity
Channel activity measures the total inbound and/or outbound activity across each of your company’s communication channels: voice, SMS, email, web chat, and social media. Depending on which channels you employ, this information can include the number of text or web chat messages sent and received, the number of emails received, and call volume.
Most VoIP phone systems log this information in a call log or report, and advanced cloud phone systems allow you to sort and compare channel activity over custom time periods–including daily, weekly, and monthly views.
17. Call Arrival Rate
Call arrival rate measures the number of calls your contact center receives, on average, over a given time period: minute, hour, day, week, or month. Most contact centers report the call arrival rate each day, dividing the day’s total number of calls by the total number of minutes, hours, or seconds in the workday.
Call arrival rate works in conjunction with other activity metrics–like call availability and first response time–to determine if your call center is appropriately staffed to meet demand.
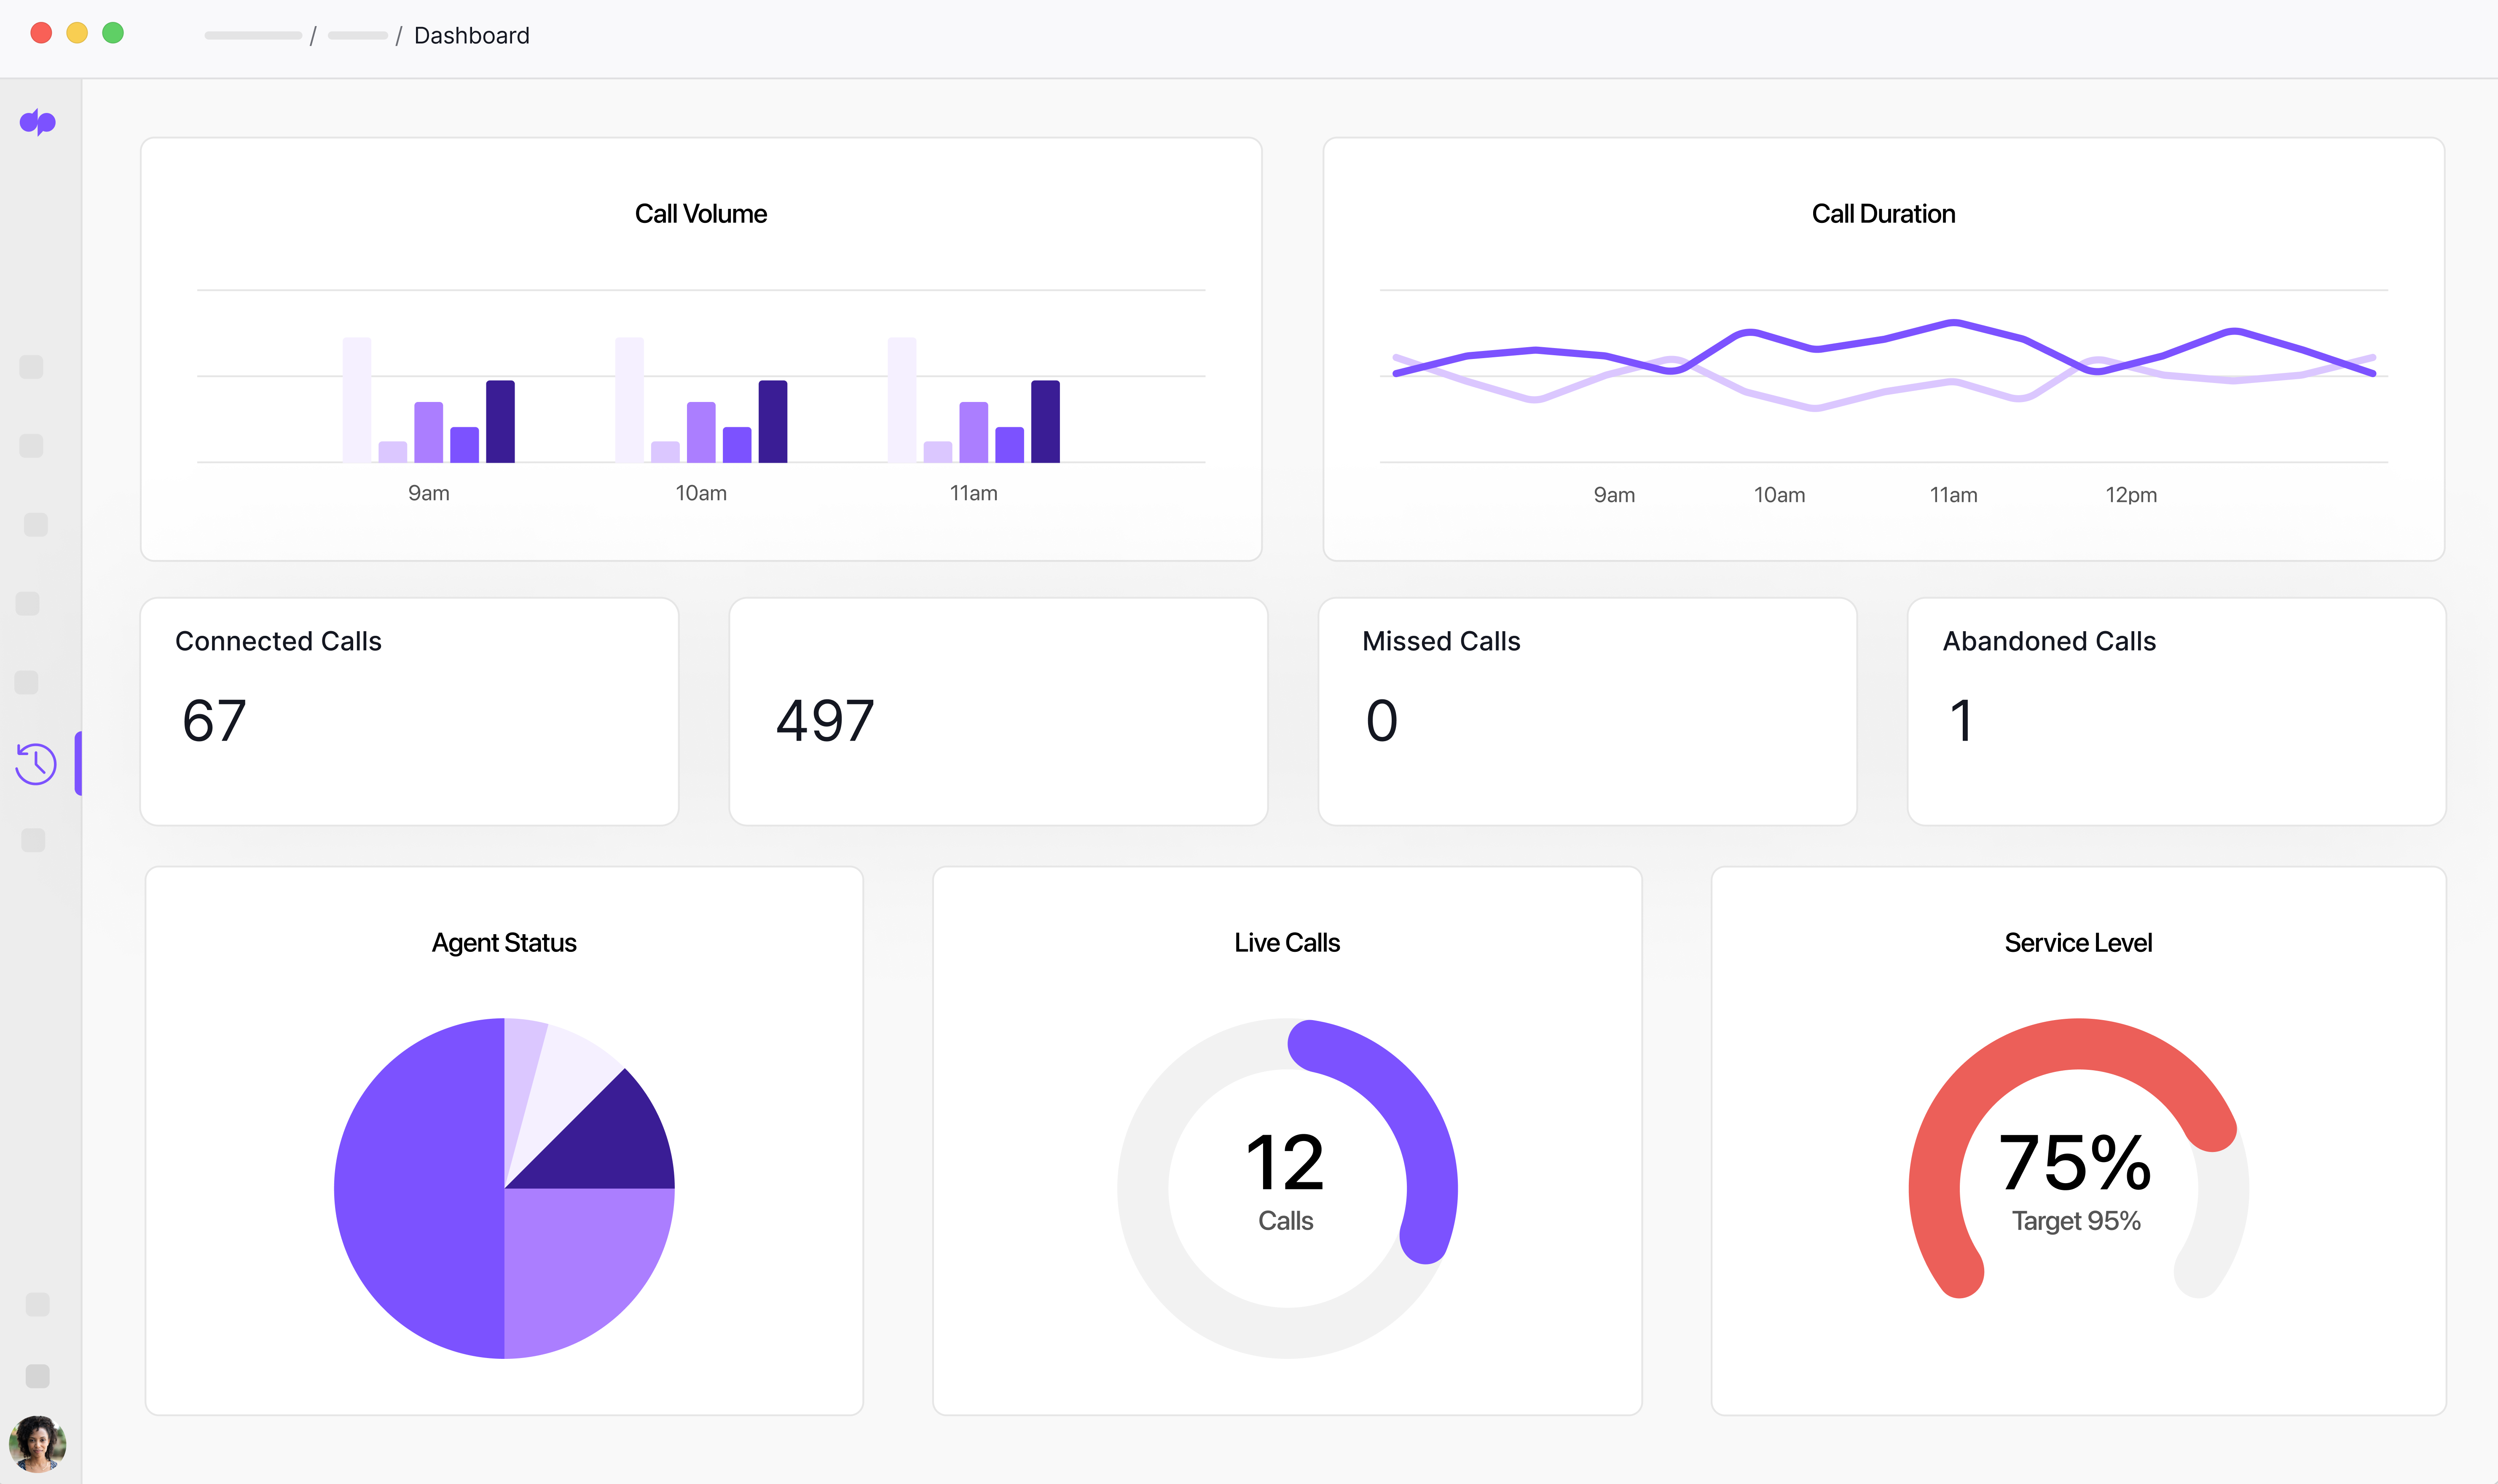
18. Service Level
Service level describes the measurable rate or quality of services that, as an organization, you promise to provide your customers. Specifically applied to a call center, service level measures the percentage of inbound calls that you answer within a predetermined length of time. For example, if your goal is to answer calls in under one minute, the day’s overall service level would be the percentage of calls that were answered within one minute.
19. Call Abandonment Rate
Call center abandonment rate measures the percentage of callers that hang up before their call is answered by an agent. Customers expect a fast answer time and become frustrated when forced to wait in a queue for a long period of time. This leads to call abandonment, which indicates dissatisfaction and forbodes customer churn.
A call rate between 5 and 8% is considered acceptable. If your rate is above this range, consider adding more agents or distributing queue wait time to maximize agent productivity during work hours.
20. Agent Turnover
Agent turnover measures the percentage of agent staff that leave your organization within a given time period–typically a year. Calculate it by dividing the number of agents who left, by the total number of agents who began the year.
While the call center industry is notorious for having a high turnover rate, a turnover rate above 50% indicates a problem. You can reduce the turnover rate by increasing agent wages, adding more staffing to take pressure off agents, improving company morale, setting clear objectives, and celebrating agent accomplishments.
21. Average After-Call Work Time
Average after-call work time (ACWT) is the average amount of time that an agent spends working on a call after the actual call has ended. This could include entering call notes into a spreadsheet, logging data, updating a customer CRM profile, or any other tasks related to wrapping up the call. Because call center agents should ideally spend most of their time on calls, the average ACWT is generally measured in seconds.
ACWT is important because it indicates agent efficiency. If ACWT is high across the board you can take measures to streamline data input in order to ease pressure on agents.
22. Average Call Length
Average call length is the average duration of a phone call. This excludes any pre-call prep or after-call work.
Also known as average talk time, call length is important because it translates directly to call-center overhead cost. The longer that customers are on the phone, the more reps you need, and the longer hold times will be. Beyond that, a long call increases the likelihood of irritating the customer and can indicate the agent’s loss of call control.
Why Call Center Metrics Matter for Your Company
Call center metrics are important to your company because they offer insights about how you can improve business functionality, improve customer and agent experience, and increase revenue.
Metrics like average occupancy rate and call availability inform managers where staffing needs are inefficient. KPIs like net promoter score and customer satisfaction score indicate how happy your customers are, which drives business reputation and revenue. Statistics like agent turnover indicate how happy your agents are, providing guidance about how to retain more staff.
To improve your ability to track your company's call center metrics, visit our call center software comparison guide to find the solution that best suits your needs.
